- Home >
- Stock Photos >
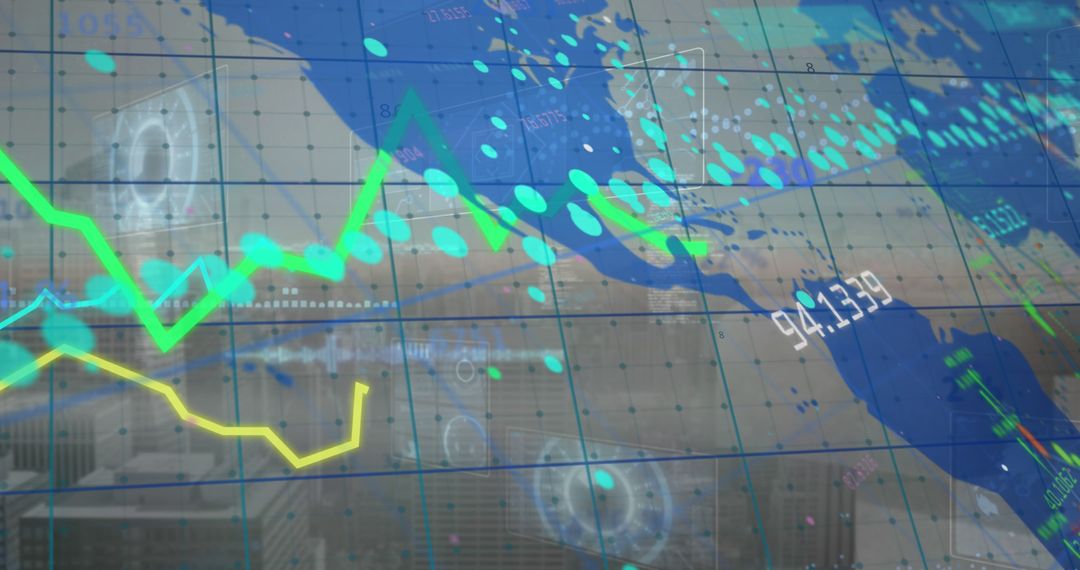
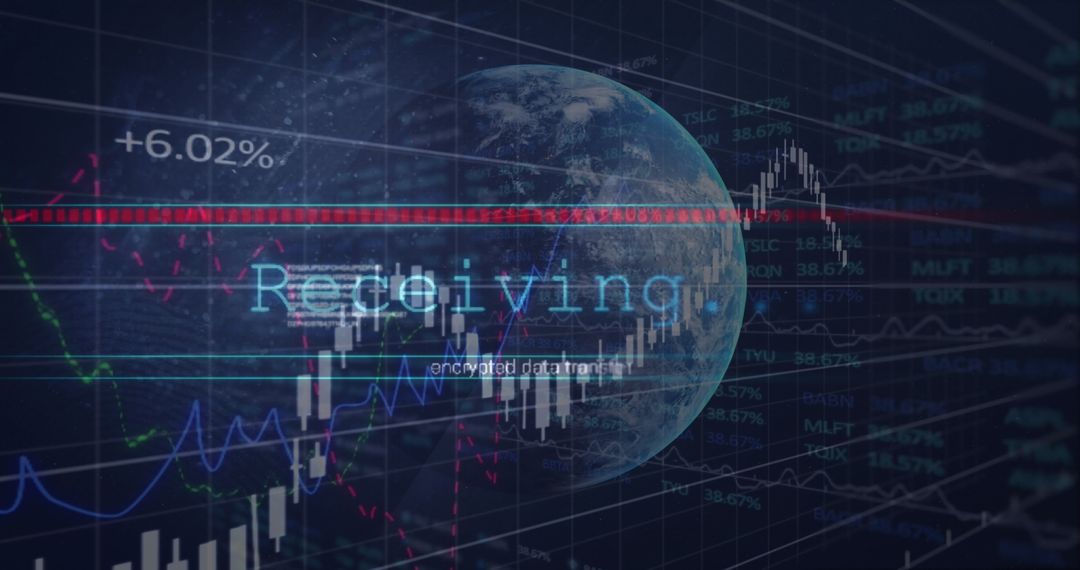
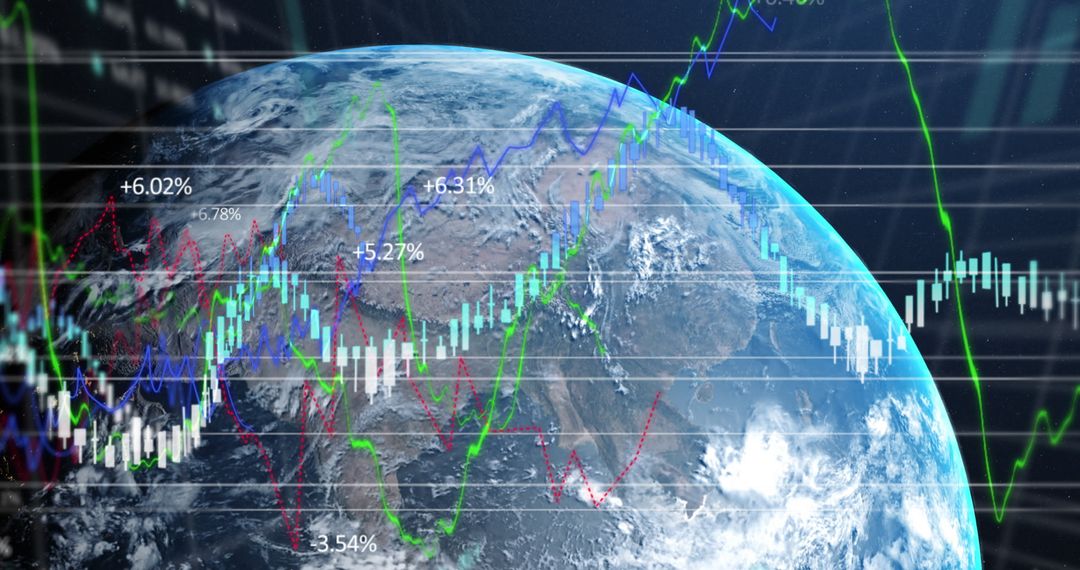
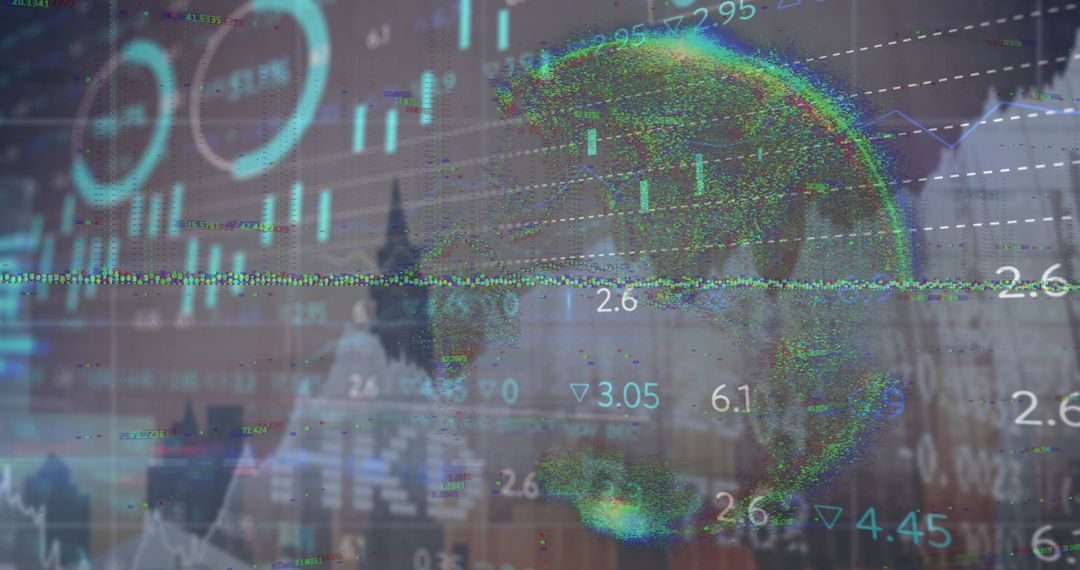
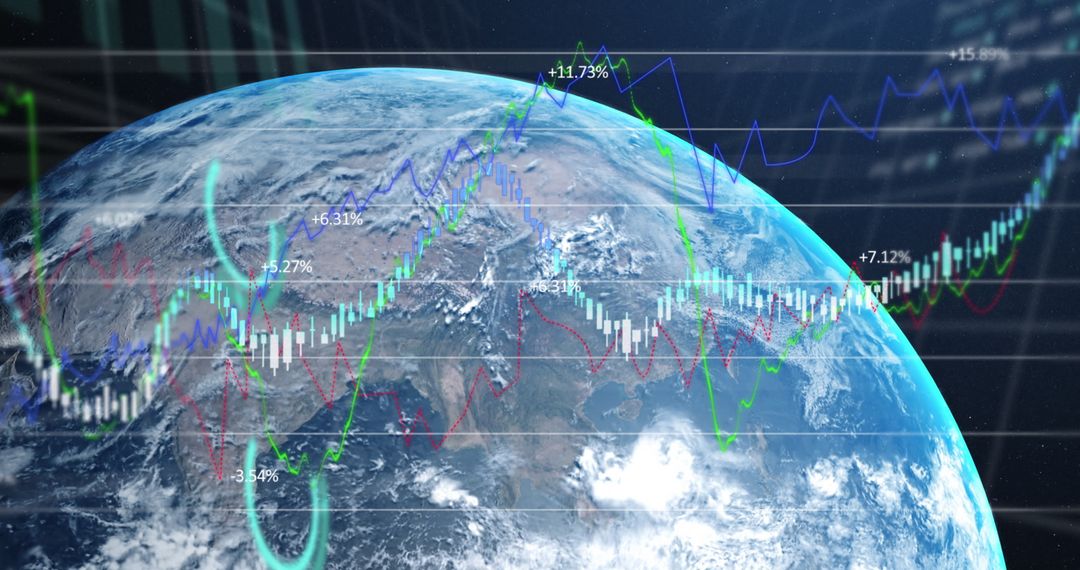
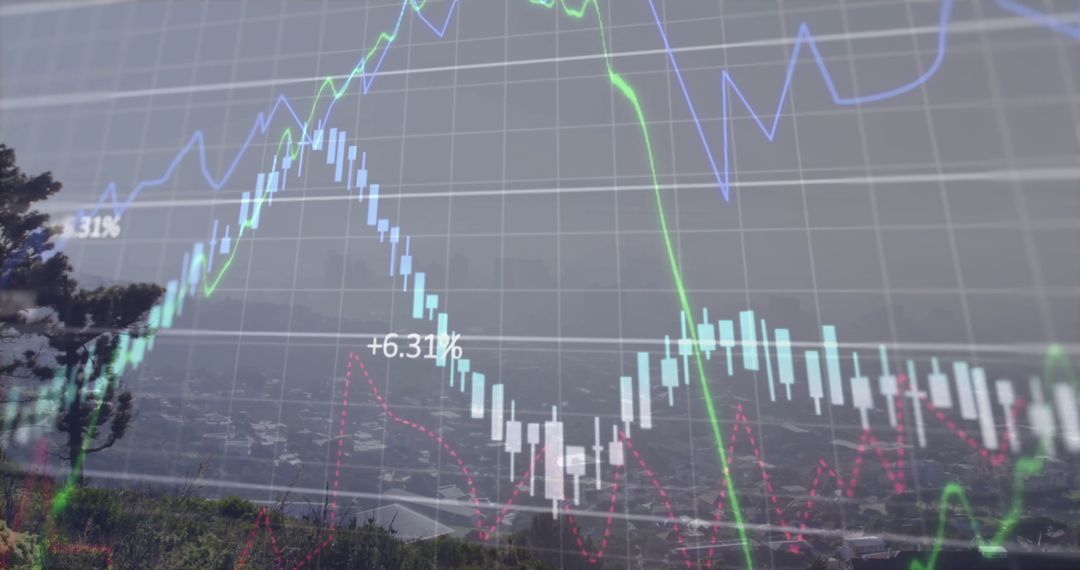
- Blending Wildlife and Technology with Data Graph Overlay
Blending Wildlife and Technology with Data Graph Overlay Image
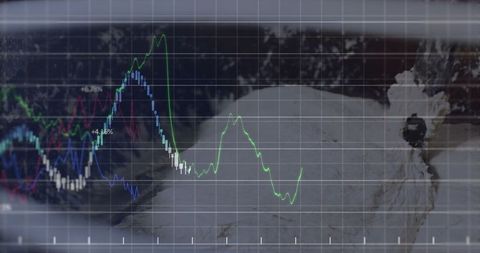
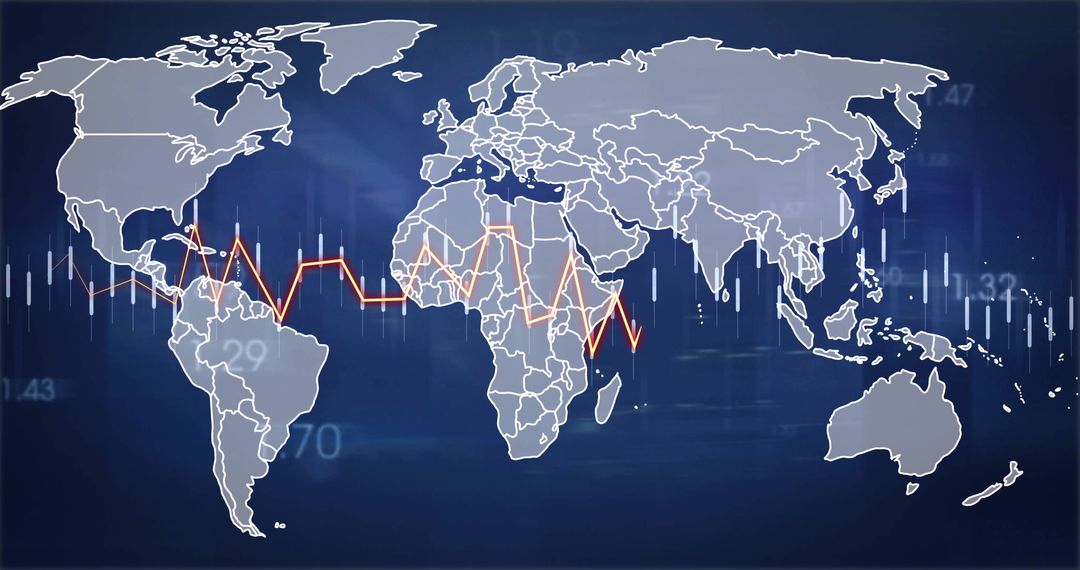
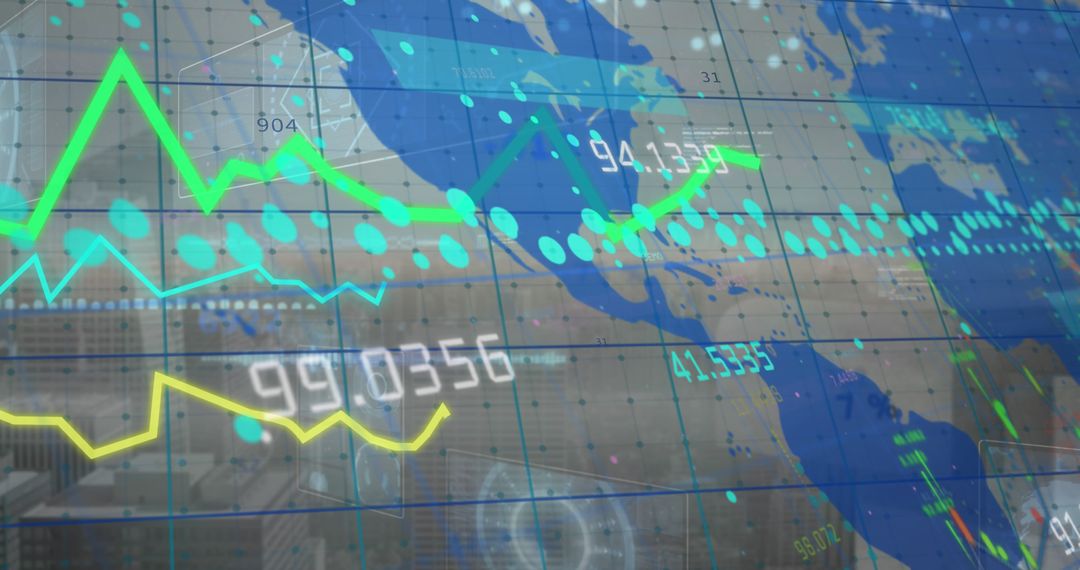
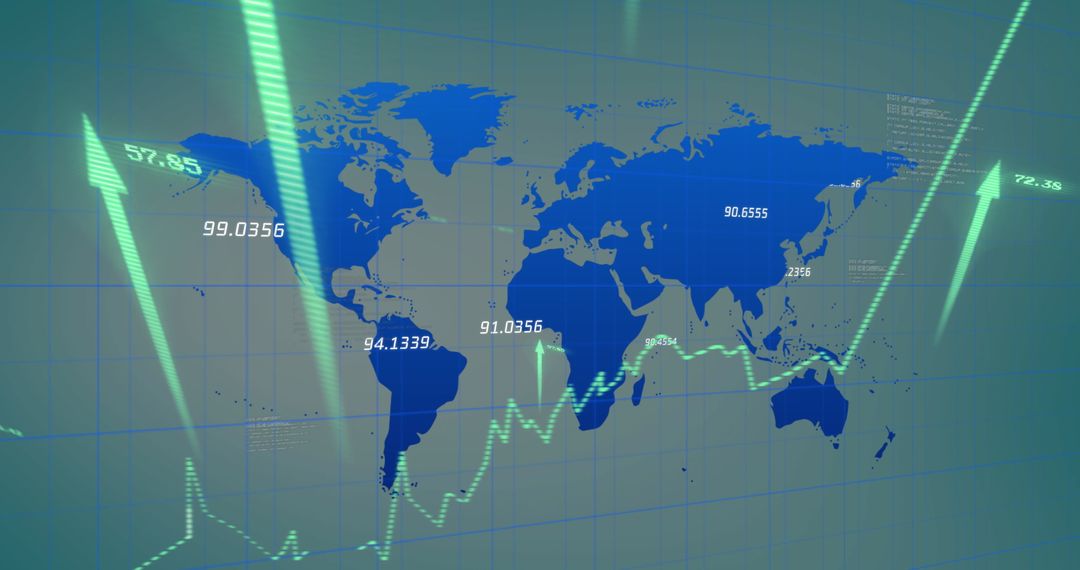
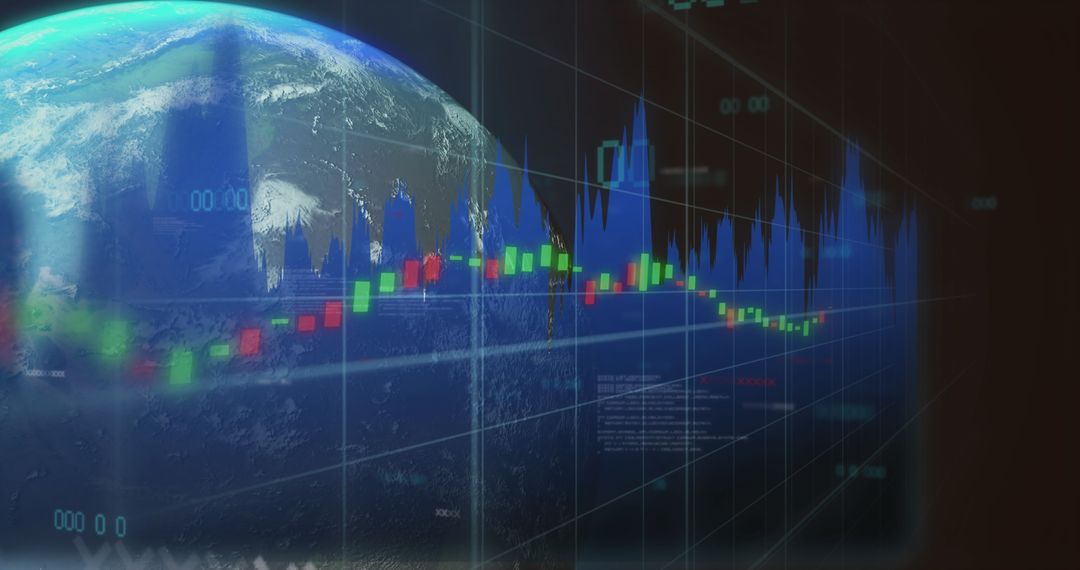
Merging a polar bear image with graph overlays creates a striking blend of nature and technology. The diverging red, blue, and green data lines illustrate analytics concepts, useful across digital, financial, and research presentations. This visual aids in communicating data-driven environmental concerns or tech advancements with a creative twist.
Powered by  - Get 15% off with code: PIKWIZARD15


0
downloads
downloads
Tags:
More
Credit Photo
If you would like to credit the Photo, here are some ways you can do so
Text Link
photo Link
<span class="text-link">
<span>
<a target="_blank" href=https://pikwizard.com/photo/blending-wildlife-and-technology-with-data-graph-overlay/5d31165d64aacf67d5ed1ae6b550bdc6/>PikWizard</a>
</span>
</span>
<span class="image-link">
<span
style="margin: 0 0 20px 0; display: inline-block; vertical-align: middle; width: 100%;"
>
<a
target="_blank"
href="https://pikwizard.com/photo/blending-wildlife-and-technology-with-data-graph-overlay/5d31165d64aacf67d5ed1ae6b550bdc6/"
style="text-decoration: none; font-size: 10px; margin: 0;"
>
<img src="https://pikwizard.com/pw/medium/5d31165d64aacf67d5ed1ae6b550bdc6.jpg" style="margin: 0; width: 100%;" alt="" />
<p style="font-size: 12px; margin: 0;">PikWizard</p>
</a>
</span>
</span>
Free (free of charge)
Free for personal and commercial use.
Author: Creative Art
Similar Free Stock Images