- Home >
- Stock Photos >
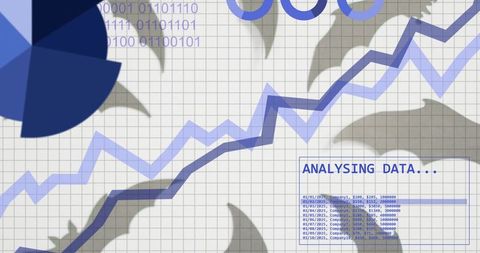
- Blue-Teal Jagged Data Graph Overlaying Halloween Crafts, Candy, Bats on Grid Mat
Blue-Teal Jagged Data Graph Overlaying Halloween Crafts, Candy, Bats on Grid Mat Image

Displaying jagged blue-teal trend line layered over Halloween craft elements such as pumpkin bucket, candy, paper bats, spider web on grid mat. Combining festive seasonal props with digital data overlay to create contrast between playful holiday theme and business analytics. Working well for seasonal marketing campaigns, retail sales reports, social media posts highlighting Halloween promotions, creative infographic headers. Suitable for e-commerce banners, holiday newsletter visuals, presentation slides, blog post covers, craft tutorial thumbnails. Allowing designers to crop for hero banners, integrate chart data for custom reports, or use as background for seasonal analytics storytelling.
Powered by  - Get 15% off with code: PIKWIZARD15


0
downloads
downloads
Tags:
More
Credit Photo
If you would like to credit the Photo, here are some ways you can do so
Text Link
photo Link
<span class="text-link">
<span>
<a target="_blank" href=https://pikwizard.com/photo/blue-teal-jagged-data-graph-overlaying-halloween-crafts-candy-bats-on-grid-mat/9f994b93b9804083f7f1e359064d8de0/>PikWizard</a>
</span>
</span>
<span class="image-link">
<span
style="margin: 0 0 20px 0; display: inline-block; vertical-align: middle; width: 100%;"
>
<a
target="_blank"
href="https://pikwizard.com/photo/blue-teal-jagged-data-graph-overlaying-halloween-crafts-candy-bats-on-grid-mat/9f994b93b9804083f7f1e359064d8de0/"
style="text-decoration: none; font-size: 10px; margin: 0;"
>
<img src="https://pikwizard.com/pw/medium/9f994b93b9804083f7f1e359064d8de0.jpg" style="margin: 0; width: 100%;" alt="" />
<p style="font-size: 12px; margin: 0;">PikWizard</p>
</a>
</span>
</span>
Free (free of charge)
Free for personal and commercial use.
Author: Creative Art
Similar Free Stock Images