- Home >
- Stock Photos >
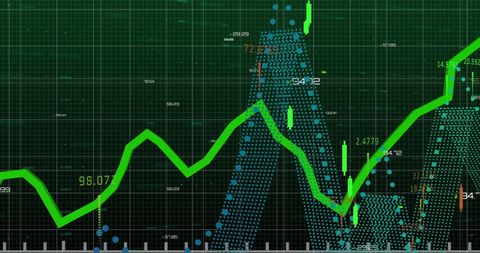
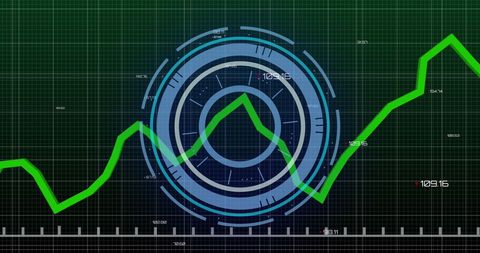
- Bright Green Trend Line on Futuristic Trading Screen
Bright Green Trend Line on Futuristic Trading Screen Image

Vibrant green zigzag trend line stands out on a digital trading dashboard, overlaid with neon blue bars and complex data patterns. This compelling visualization is fitting for use in financial reports, presentations on stock market trends, economic forecasting, and analytics. Suitable for websites and blogs focused on trading, investment analysis, and financial technology advancements.
Powered by  - Get 15% off with code: PIKWIZARD15


0
downloads
downloads
Tags:
More
Credit Photo
If you would like to credit the Photo, here are some ways you can do so
Text Link
photo Link
<span class="text-link">
<span>
<a target="_blank" href=https://pikwizard.com/photo/bright-green-trend-line-on-futuristic-trading-screen/f57ea4fdeec59f648656bcb3cc276b2e/>PikWizard</a>
</span>
</span>
<span class="image-link">
<span
style="margin: 0 0 20px 0; display: inline-block; vertical-align: middle; width: 100%;"
>
<a
target="_blank"
href="https://pikwizard.com/photo/bright-green-trend-line-on-futuristic-trading-screen/f57ea4fdeec59f648656bcb3cc276b2e/"
style="text-decoration: none; font-size: 10px; margin: 0;"
>
<img src="https://pikwizard.com/pw/medium/f57ea4fdeec59f648656bcb3cc276b2e.jpg" style="margin: 0; width: 100%;" alt="" />
<p style="font-size: 12px; margin: 0;">PikWizard</p>
</a>
</span>
</span>
Free (free of charge)
Free for personal and commercial use.
Author: Awesome Content
Similar Free Stock Images

Premium


Premium


Premium


Premium


Premium


Premium


Premium


Premium


Premium


Premium


Premium


Premium


Premium


Premium


Premium


Premium


Premium


Premium


Premium


Premium


Premium


Premium


Premium


Premium


Premium