- Home >
- Stock Photos >
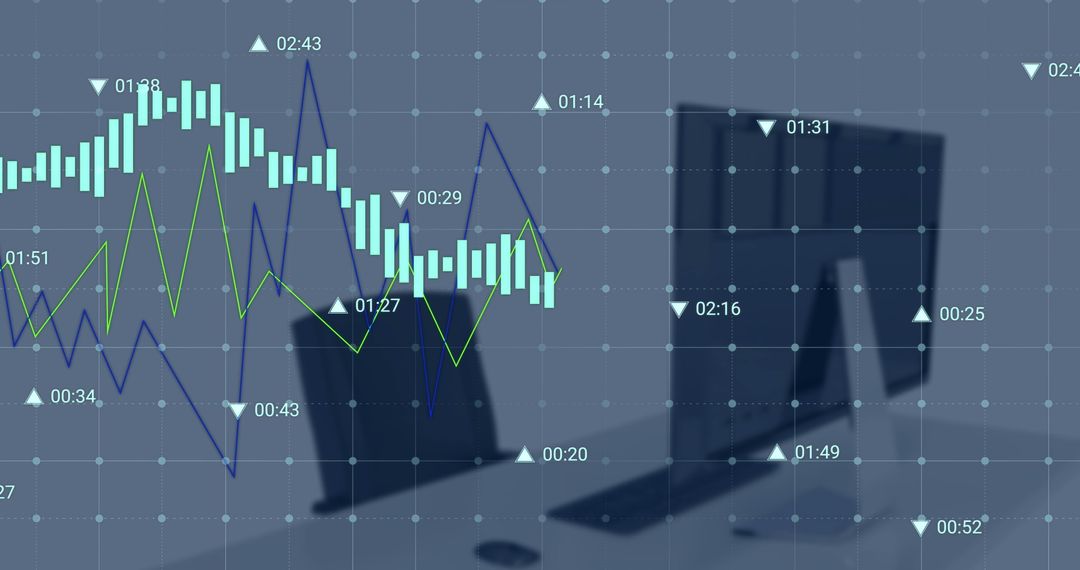
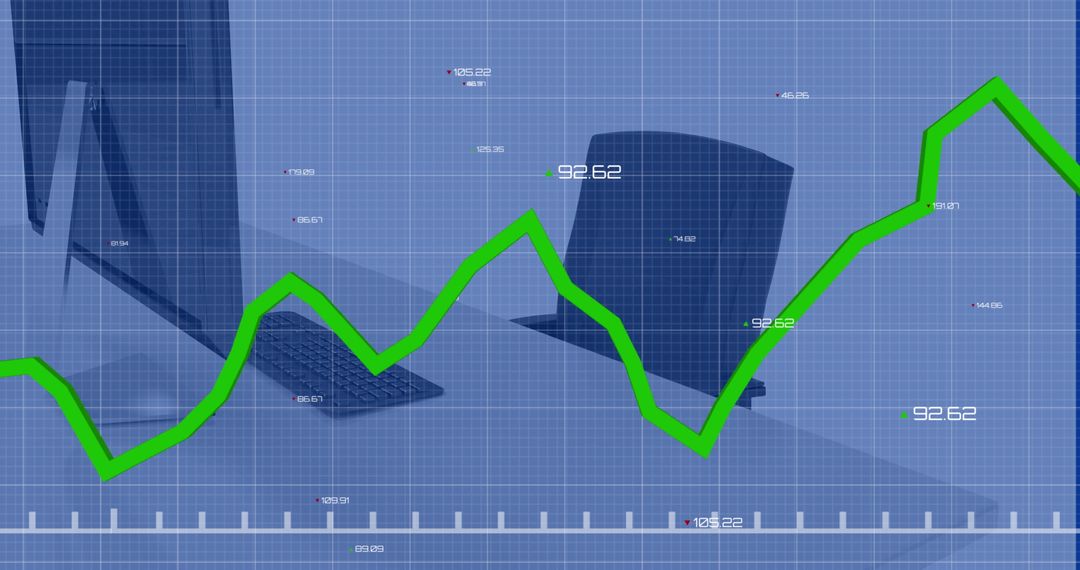
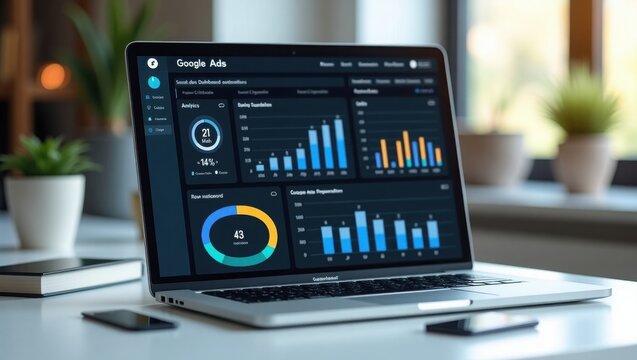
- Business Analytics Concept with Laptop and Graphs on Desktop
Business Analytics Concept with Laptop and Graphs on Desktop Image
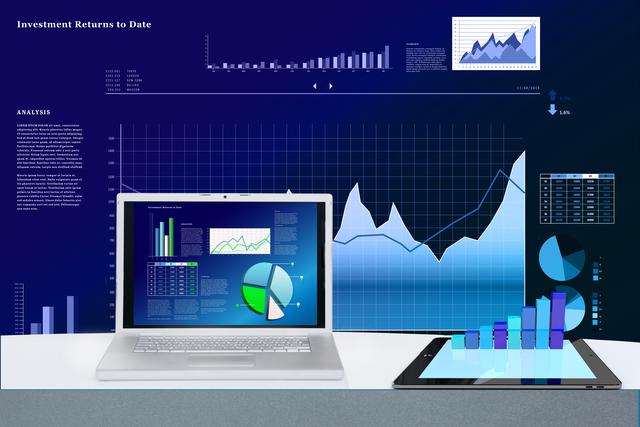
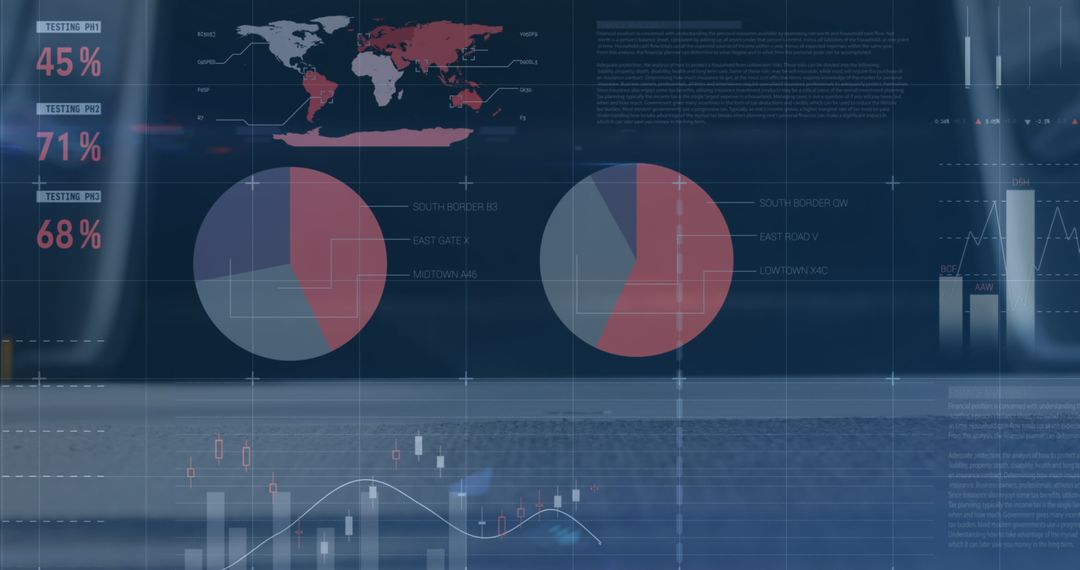
This image shows a laptop and a tablet displaying various graphs and data visualizations, set against a background of financial charts. Ideal for depicting themes around business analytics, financial growth, technology in business environments, data-driven decision making, investment strategies, or corporate presentations. Use in digital content marketing, educational materials, or stock photos for websites and blogs.
Powered by 


547
downloads
downloads
Tags:
More
Credit Photo
If you would like to credit the Photo, here are some ways you can do so
Text Link
photo Link
<span class="text-link">
<span>
<a target="_blank" href=https://pikwizard.com/photo/business-analytics-concept-with-laptop-and-graphs-on-desktop/f94aabccea3421cef95159d9997bc28c/>PikWizard</a>
</span>
</span>
<span class="image-link">
<span
style="margin: 0 0 20px 0; display: inline-block; vertical-align: middle; width: 100%;"
>
<a
target="_blank"
href="https://pikwizard.com/photo/business-analytics-concept-with-laptop-and-graphs-on-desktop/f94aabccea3421cef95159d9997bc28c/"
style="text-decoration: none; font-size: 10px; margin: 0;"
>
<img src="https://pikwizard.com/pw/medium/f94aabccea3421cef95159d9997bc28c.jpg" style="margin: 0; width: 100%;" alt="" />
<p style="font-size: 12px; margin: 0;">PikWizard</p>
</a>
</span>
</span>
Free (free of charge)
Free for personal and commercial use.
Author: Creative Art
Similar Free Stock Images
Premium


Premium


Premium


Premium


Premium


Premium


Premium


Premium


Premium


Premium


Premium


Premium


Premium


Premium


Premium


Premium


Premium


Premium


Premium


Premium


Premium


Premium


Premium


Premium