- Home >
- Stock Photos >
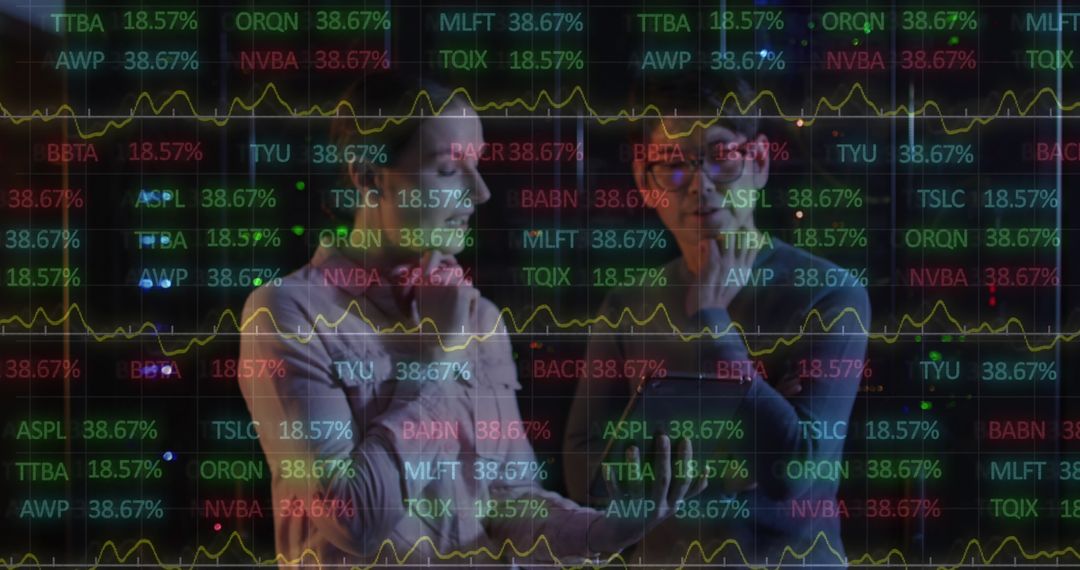
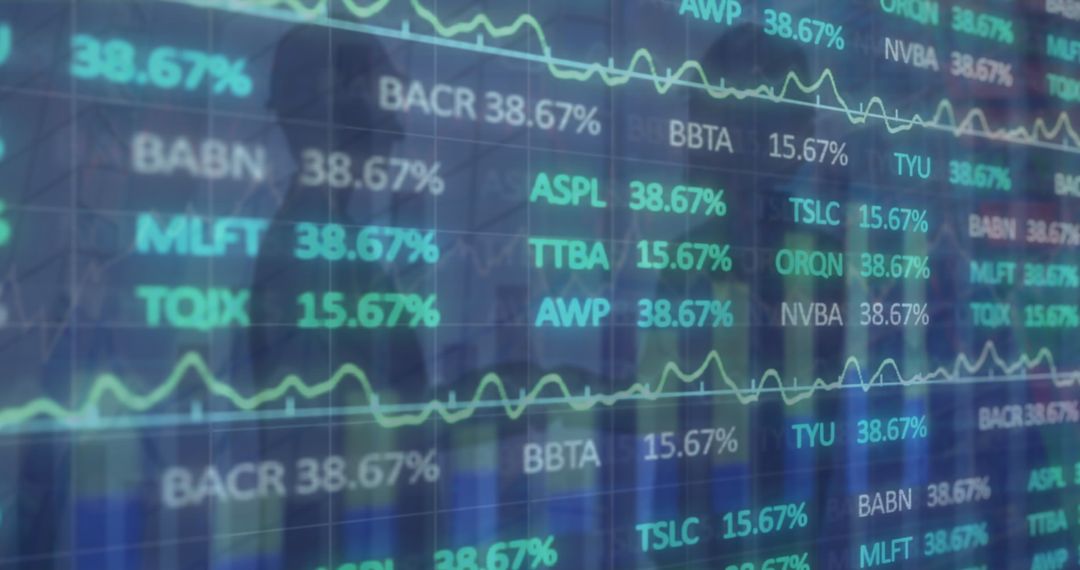
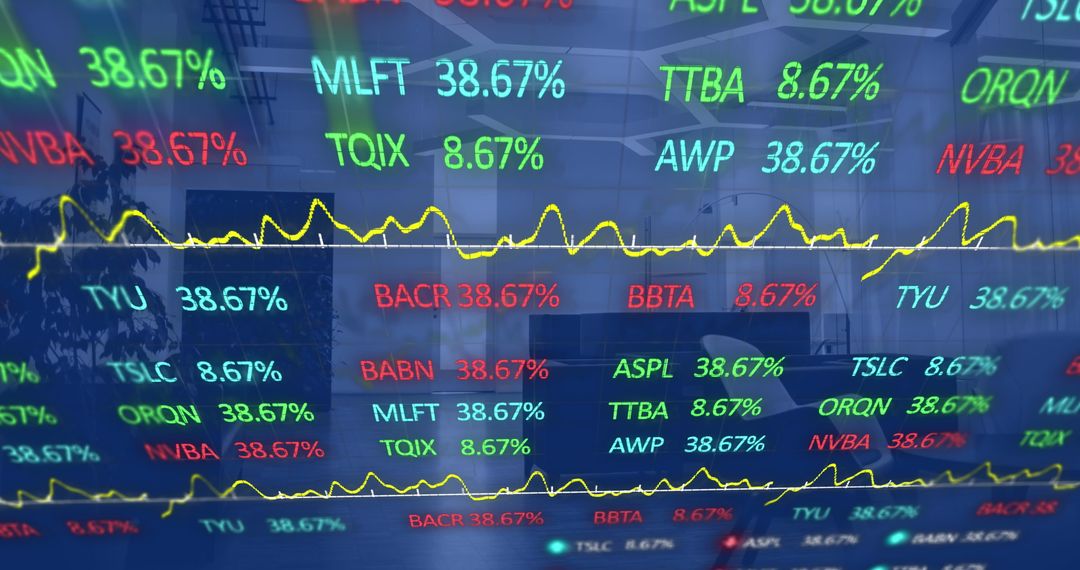
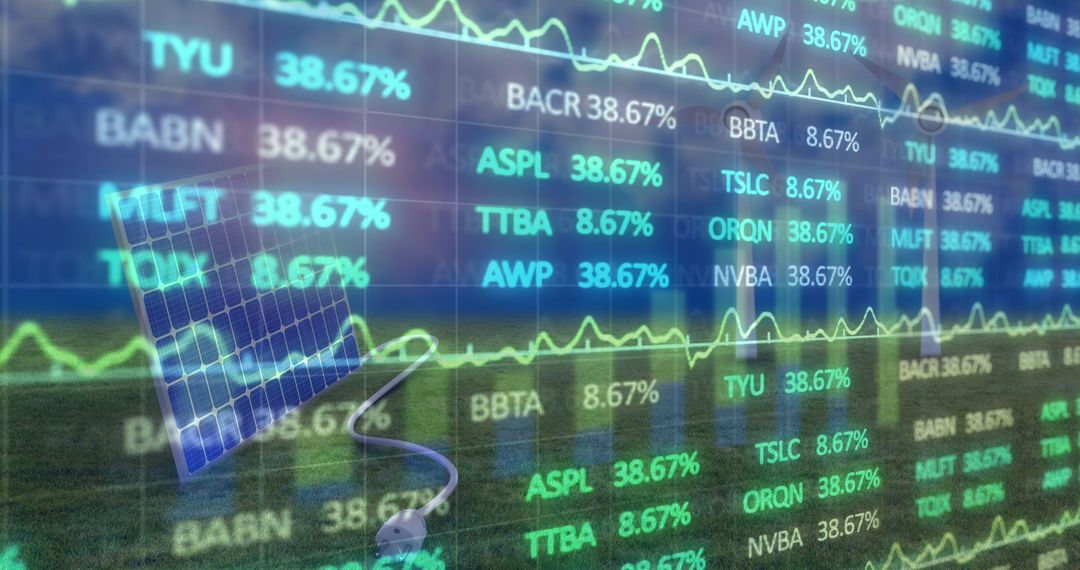
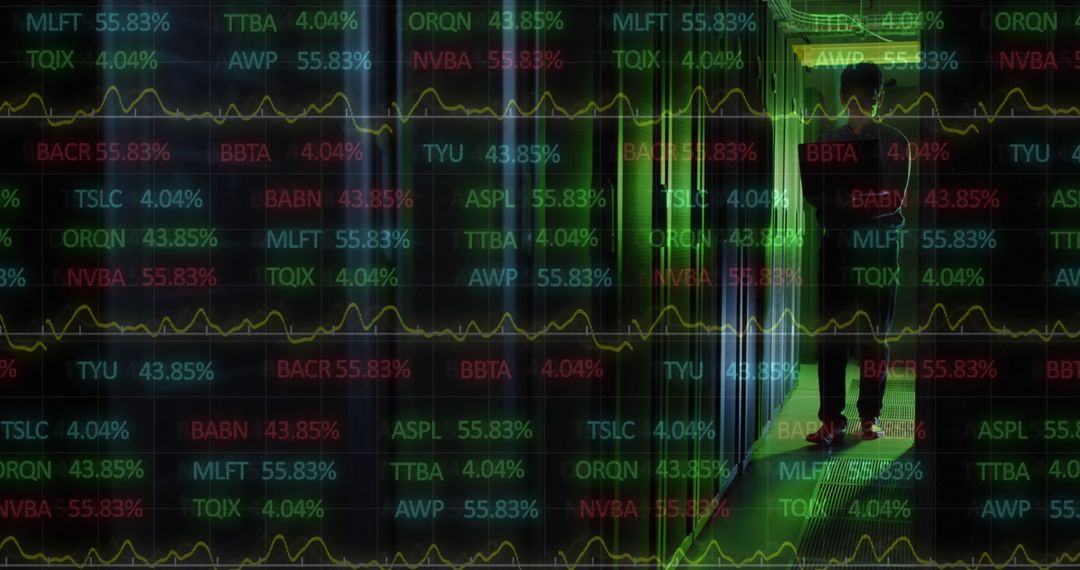
- Business Colleagues Analyzing Stock Market Data Visualization
Business Colleagues Analyzing Stock Market Data Visualization Image

Two business professionals are seen discussing important matters behind a transparent screen projecting stock market data. The blend of finance numbers over their workforce silhouette indicates a focus on transparent investment strategies. This image is suitable for banners, advertisements, and articles regarding finance, tech in business, or the evolving global economy.
Powered by  - Get 15% off with code: PIKWIZARD15


2
downloads
downloads
Tags:
More
Credit Photo
If you would like to credit the Photo, here are some ways you can do so
Text Link
photo Link
<span class="text-link">
<span>
<a target="_blank" href=https://pikwizard.com/photo/business-colleagues-analyzing-stock-market-data-visualization/b732270c5fdd9b1d2cf6a028d79d82af/>PikWizard</a>
</span>
</span>
<span class="image-link">
<span
style="margin: 0 0 20px 0; display: inline-block; vertical-align: middle; width: 100%;"
>
<a
target="_blank"
href="https://pikwizard.com/photo/business-colleagues-analyzing-stock-market-data-visualization/b732270c5fdd9b1d2cf6a028d79d82af/"
style="text-decoration: none; font-size: 10px; margin: 0;"
>
<img src="https://pikwizard.com/pw/medium/b732270c5fdd9b1d2cf6a028d79d82af.jpg" style="margin: 0; width: 100%;" alt="" />
<p style="font-size: 12px; margin: 0;">PikWizard</p>
</a>
</span>
</span>
Free (free of charge)
Free for personal and commercial use.
Author: People Creations
Similar Free Stock Images

Premium


Premium


Premium


Premium


Premium


Premium


Premium


Premium


Premium


Premium


Premium


Premium


Premium


Premium


Premium


Premium


Premium


Premium


Premium


Premium


Premium


Premium


Premium


Premium