- Home >
- Stock Photos >
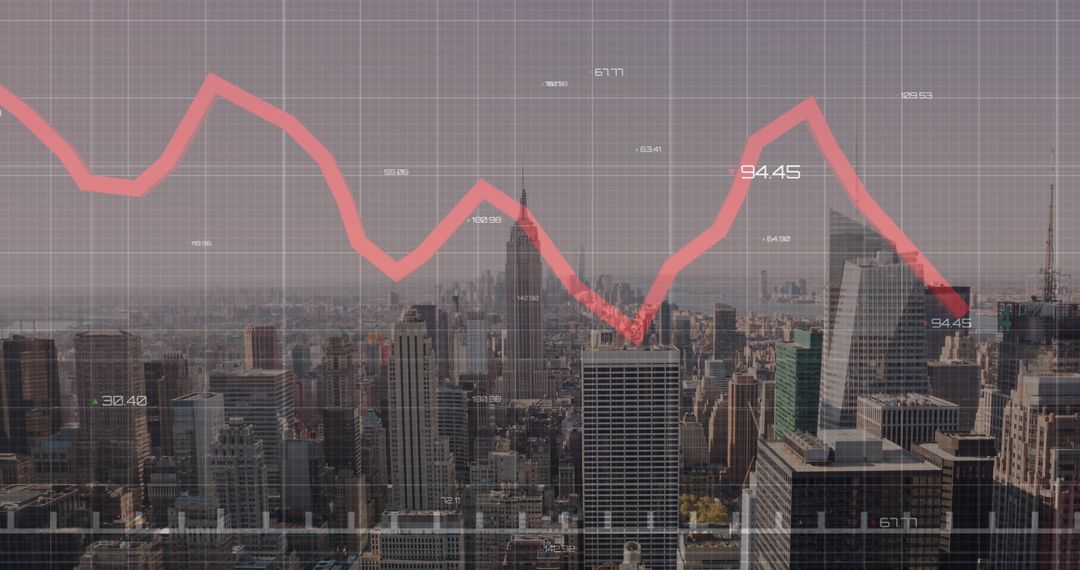
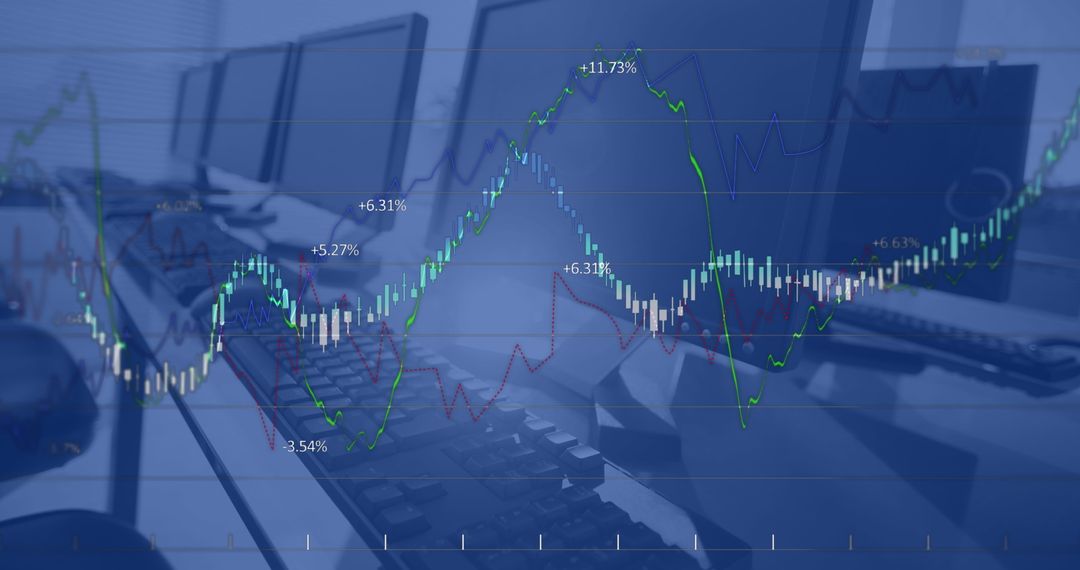
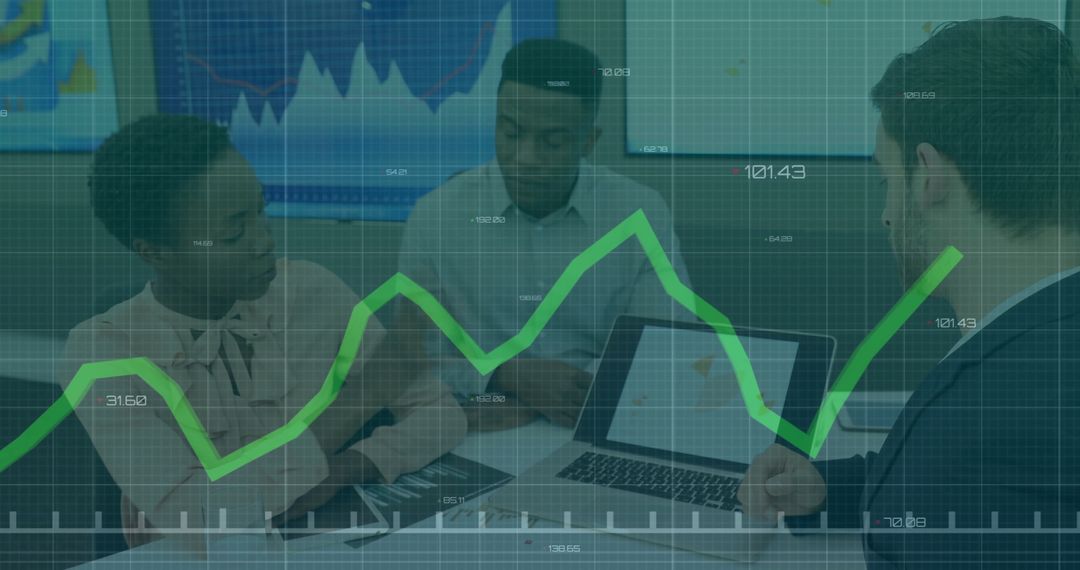
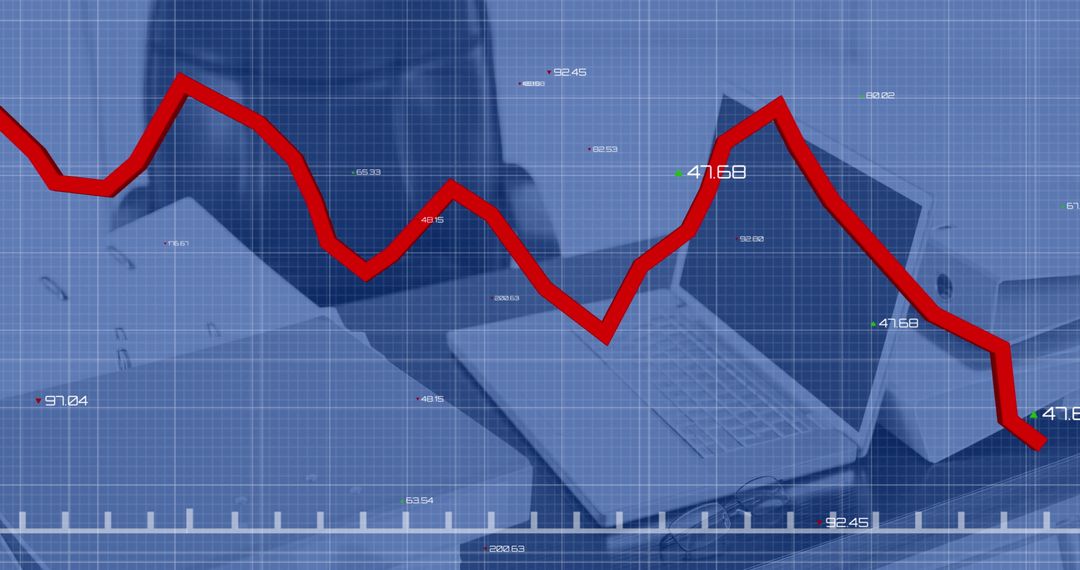
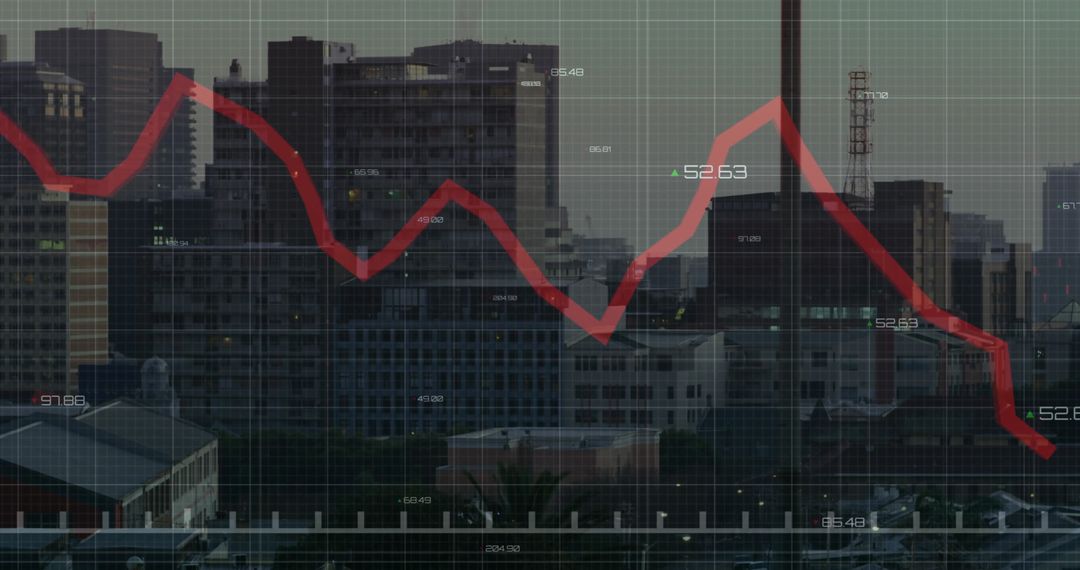
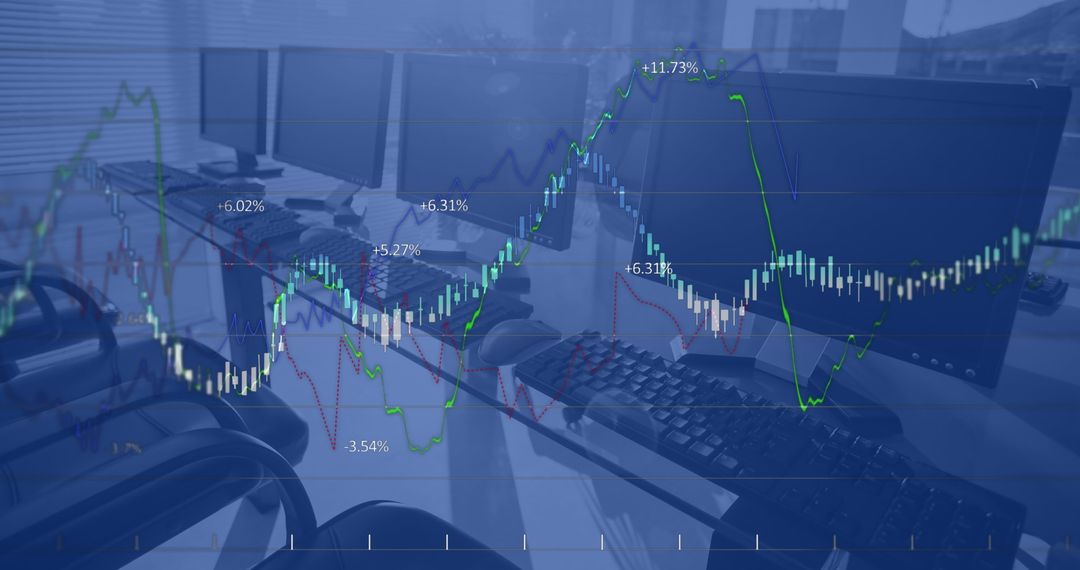
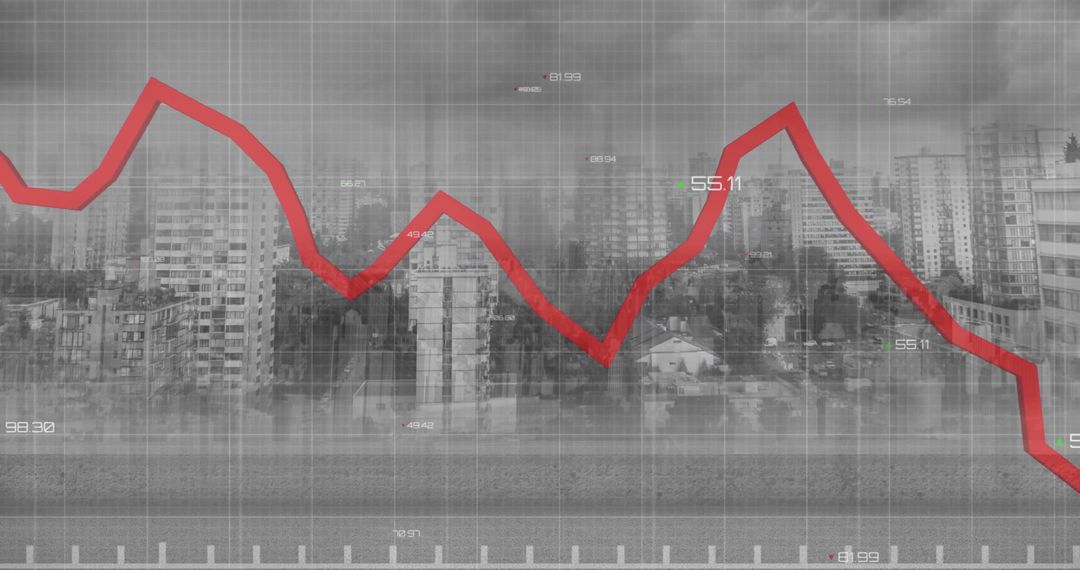
- Business Graph on Office Computer Desks Background
Business Graph on Office Computer Desks Background Image
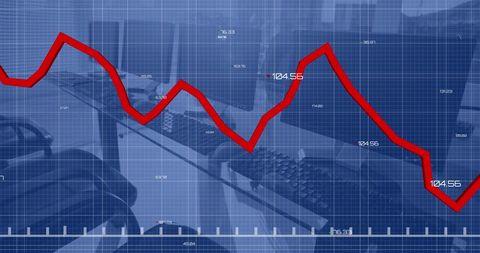
The red graph overlay on a blurred office background of computer desks suggests focus on business analytics and financial trends. Useful for illustrating topics in business articles, economic reports, or for visuals demonstrating market analysis and technology’s role in business.
Powered by  - Get 15% off with code: PIKWIZARD15


Credit Photo
If you would like to credit the Photo, here are some ways you can do so
Text Link
photo Link
<span class="text-link">
<span>
<a target="_blank" href=https://pikwizard.com/photo/business-graph-on-office-computer-desks-background/f35b48a761c3f3bfb6c4511384773de6/>PikWizard</a>
</span>
</span>
<span class="image-link">
<span
style="margin: 0 0 20px 0; display: inline-block; vertical-align: middle; width: 100%;"
>
<a
target="_blank"
href="https://pikwizard.com/photo/business-graph-on-office-computer-desks-background/f35b48a761c3f3bfb6c4511384773de6/"
style="text-decoration: none; font-size: 10px; margin: 0;"
>
<img src="https://pikwizard.com/pw/medium/f35b48a761c3f3bfb6c4511384773de6.jpg" style="margin: 0; width: 100%;" alt="" />
<p style="font-size: 12px; margin: 0;">PikWizard</p>
</a>
</span>
</span>
Free (free of charge)
Free for personal and commercial use.
Author: Creative Art
Similar Free Stock Images
Premium


Premium


Premium


Premium


Premium


Premium


Premium


Premium


Premium


Premium


Premium


Premium


Premium


Premium


Premium


Premium


Premium


Premium


Premium


Premium


Premium


Premium


Premium


Premium