- Home >
- Stock Photos >
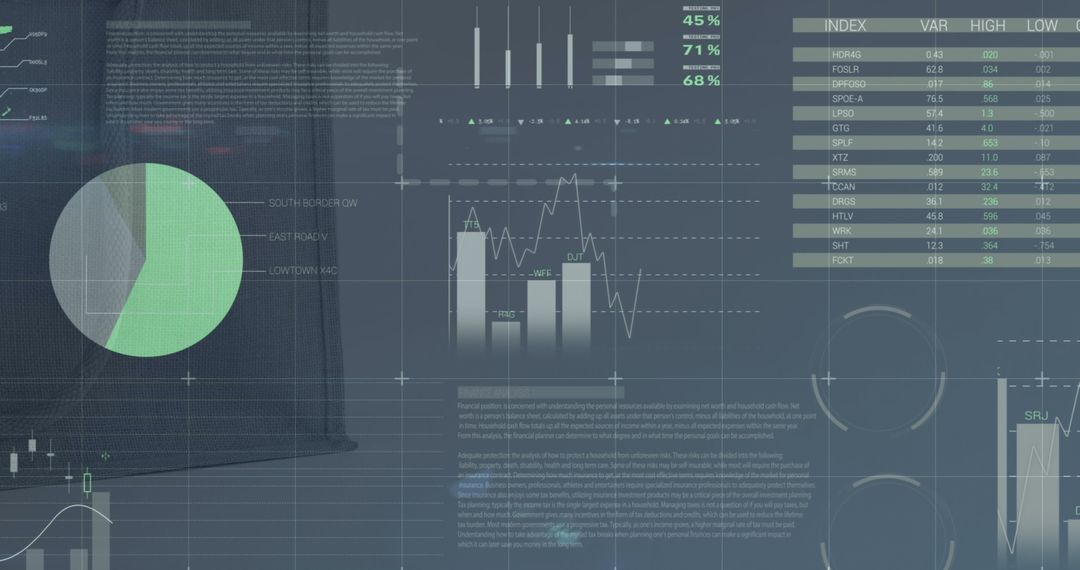
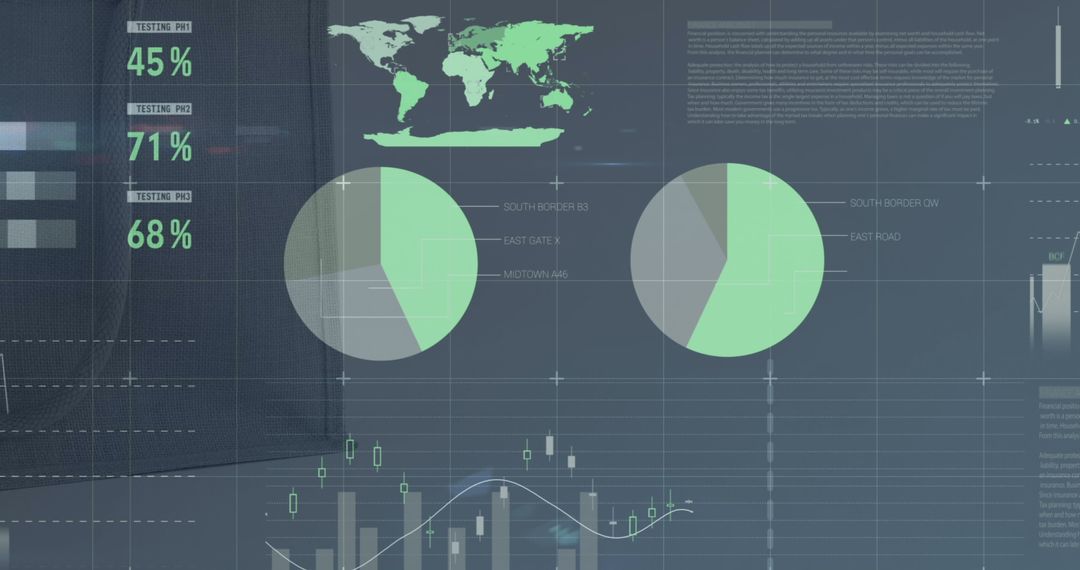
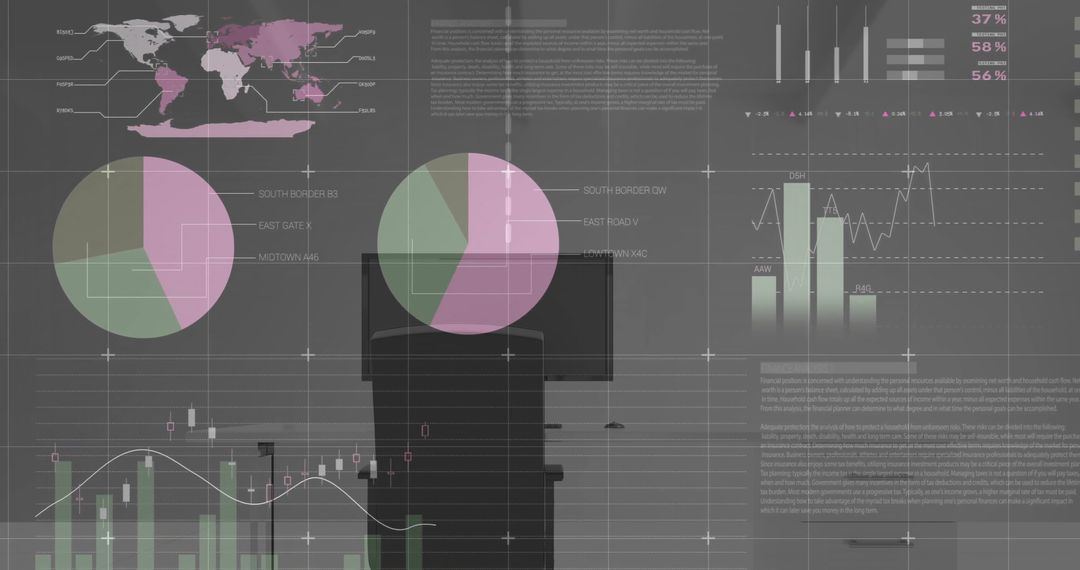
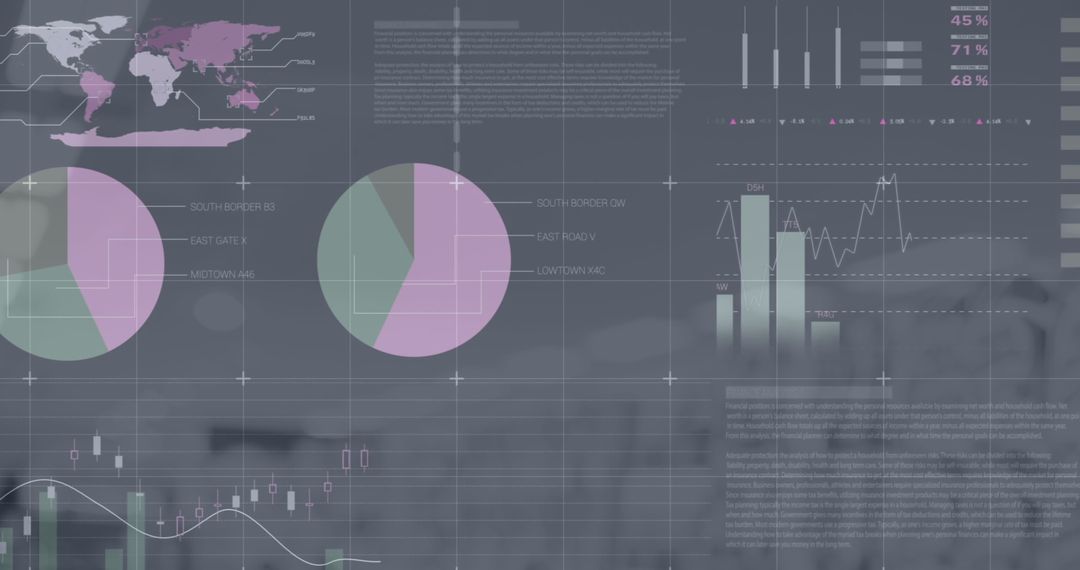
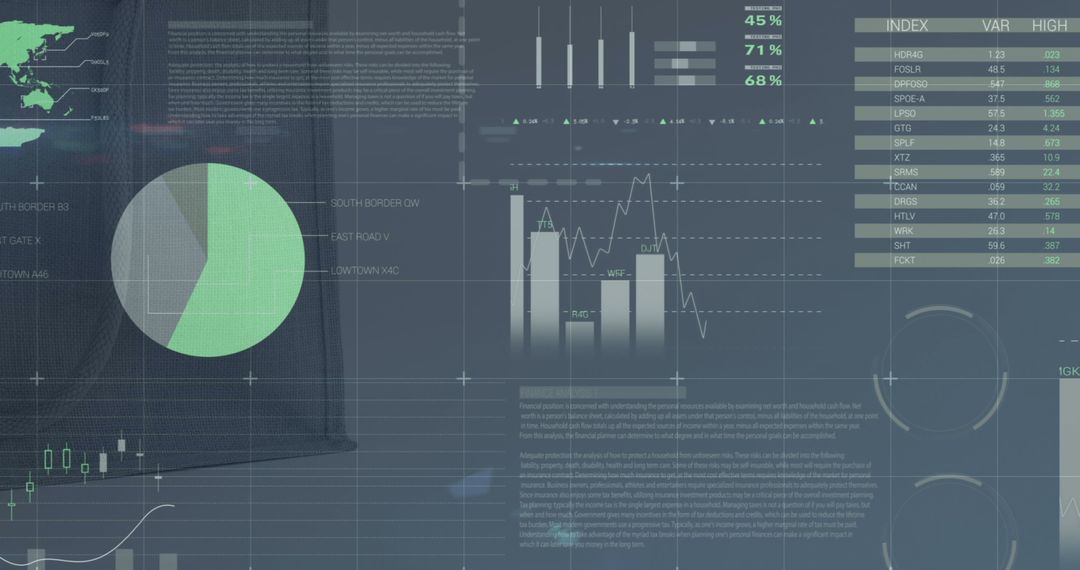
- Business Infographic and Tablet with Financial Chart Overlays
Business Infographic and Tablet with Financial Chart Overlays Image

Visual captures business infographic with colorful pie chart overlays on digital tablet screen. Use it for illustrating concepts in financial analysis, tech-driven reports, data-driven business decision making, educational materials on investments, and presentations focusing on technology in modern business environments.
Powered by 


2
downloads
downloads
Tags:
More
Credit Photo
If you would like to credit the Photo, here are some ways you can do so
Text Link
photo Link
<span class="text-link">
<span>
<a target="_blank" href=https://pikwizard.com/photo/business-infographic-and-tablet-with-financial-chart-overlays/9bc119309cf6a1f521a1622f3cb7cab8/>PikWizard</a>
</span>
</span>
<span class="image-link">
<span
style="margin: 0 0 20px 0; display: inline-block; vertical-align: middle; width: 100%;"
>
<a
target="_blank"
href="https://pikwizard.com/photo/business-infographic-and-tablet-with-financial-chart-overlays/9bc119309cf6a1f521a1622f3cb7cab8/"
style="text-decoration: none; font-size: 10px; margin: 0;"
>
<img src="https://pikwizard.com/pw/medium/9bc119309cf6a1f521a1622f3cb7cab8.jpg" style="margin: 0; width: 100%;" alt="" />
<p style="font-size: 12px; margin: 0;">PikWizard</p>
</a>
</span>
</span>
Free (free of charge)
Free for personal and commercial use.
Author: People Creations
Similar Free Stock Images

Premium


Premium


Premium


Premium


Premium


Premium


Premium


Premium


Premium


Premium


Premium


Premium


Premium


Premium


Premium


Premium


Premium


Premium


Premium


Premium


Premium


Premium


Premium


Premium