- Home >
- Stock Photos >
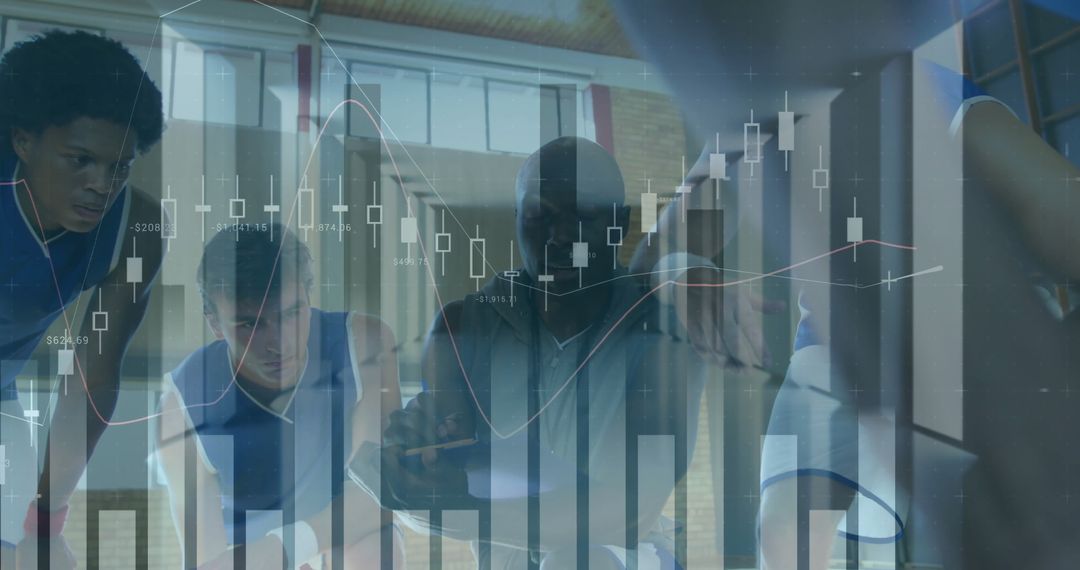
- Business Team Analyzing Financial Data with Candlestick Graphs
Business Team Analyzing Financial Data with Candlestick Graphs Image

Business team engages in analysis with overlaid financial graphs, reflecting stock market trends. Useful for themes related to finance, teamwork, market analysis, and data processing. Ideal for illustrating corporate strategies, investment planning, and economic discussions.
Powered by 


2
downloads
downloads
Tags:
More
Credit Photo
If you would like to credit the Photo, here are some ways you can do so
Text Link
photo Link
<span class="text-link">
<span>
<a target="_blank" href=https://pikwizard.com/photo/business-team-analyzing-financial-data-with-candlestick-graphs/66369f054e17056c3a8d02537945c3e7/>PikWizard</a>
</span>
</span>
<span class="image-link">
<span
style="margin: 0 0 20px 0; display: inline-block; vertical-align: middle; width: 100%;"
>
<a
target="_blank"
href="https://pikwizard.com/photo/business-team-analyzing-financial-data-with-candlestick-graphs/66369f054e17056c3a8d02537945c3e7/"
style="text-decoration: none; font-size: 10px; margin: 0;"
>
<img src="https://pikwizard.com/pw/medium/66369f054e17056c3a8d02537945c3e7.jpg" style="margin: 0; width: 100%;" alt="" />
<p style="font-size: 12px; margin: 0;">PikWizard</p>
</a>
</span>
</span>
Free (free of charge)
Free for personal and commercial use.
Author: Awesome Content
Similar Free Stock Images

Premium


Premium


Premium


Premium


Premium


Premium


Premium


Premium


Premium


Premium


Premium


Premium


Premium


Premium


Premium


Premium


Premium


Premium


Premium


Premium


Premium


Premium


Premium


Premium