- Home >
- Stock Photos >
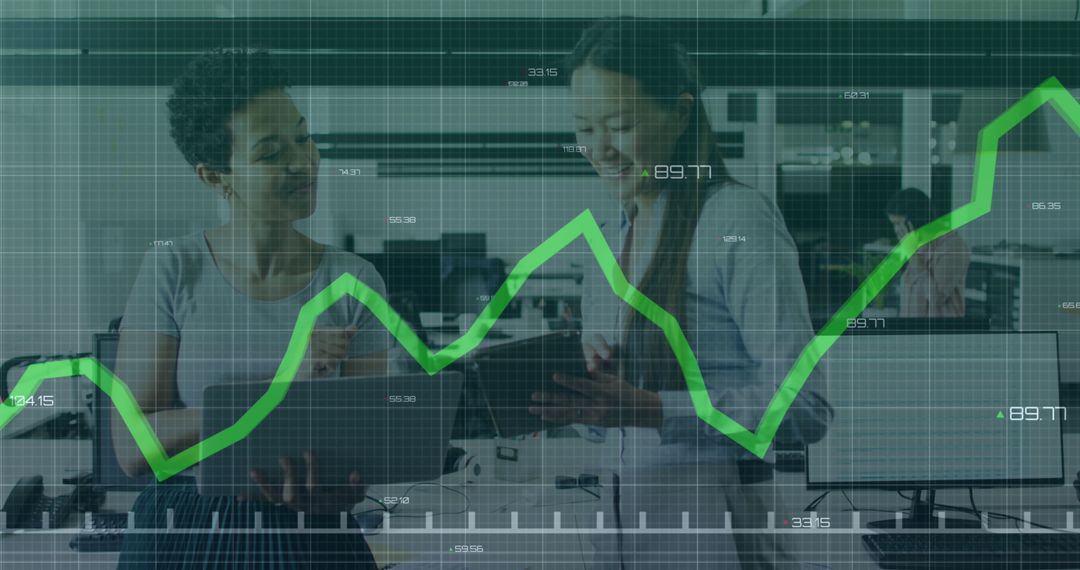
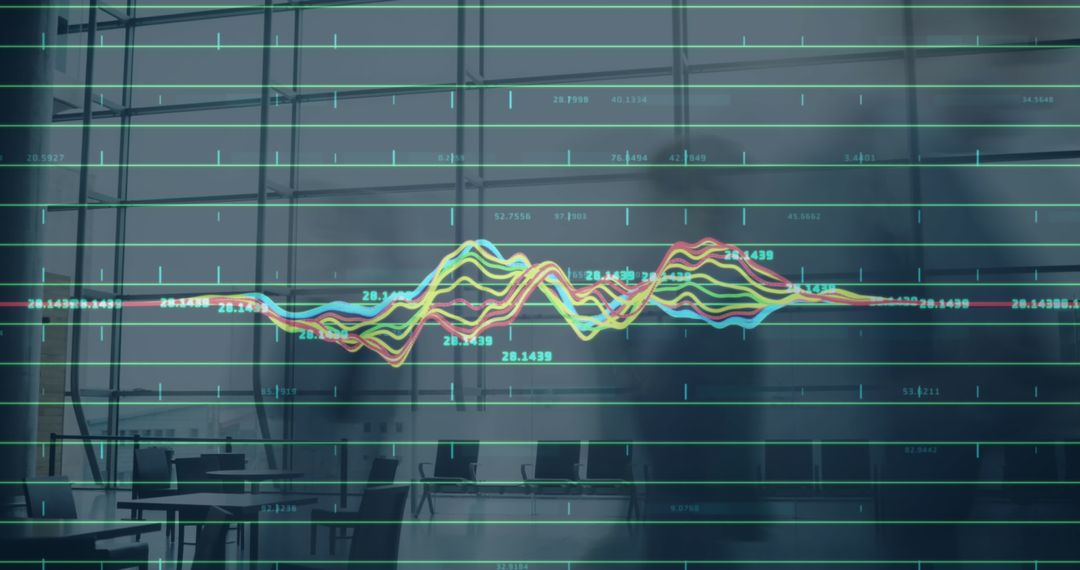
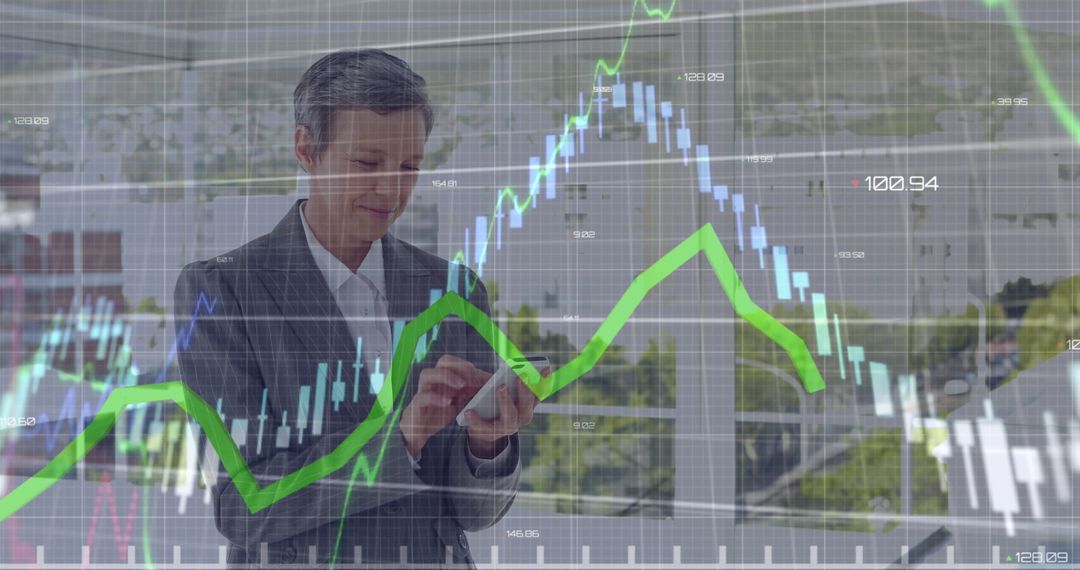
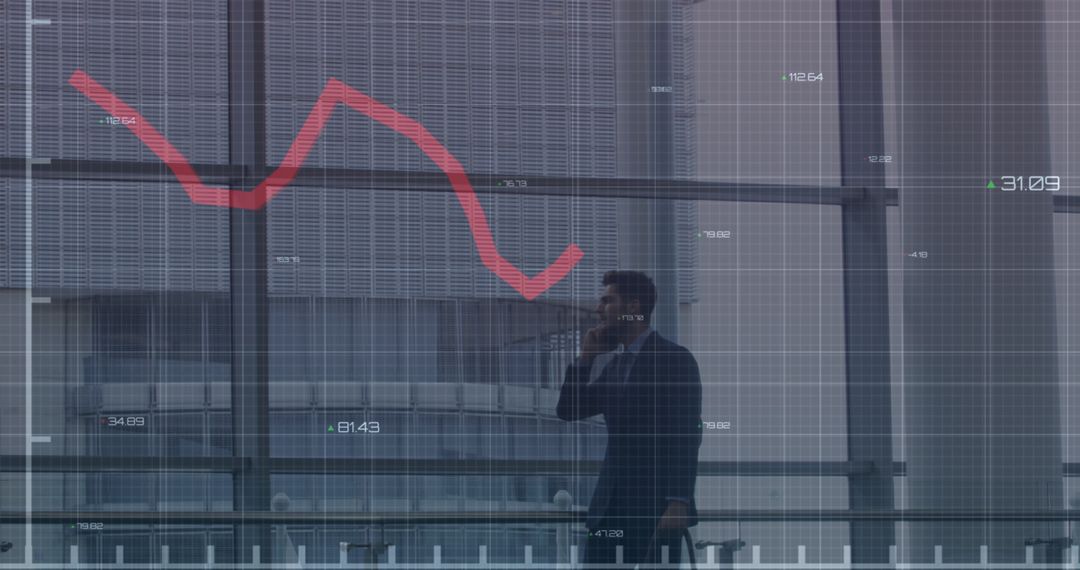
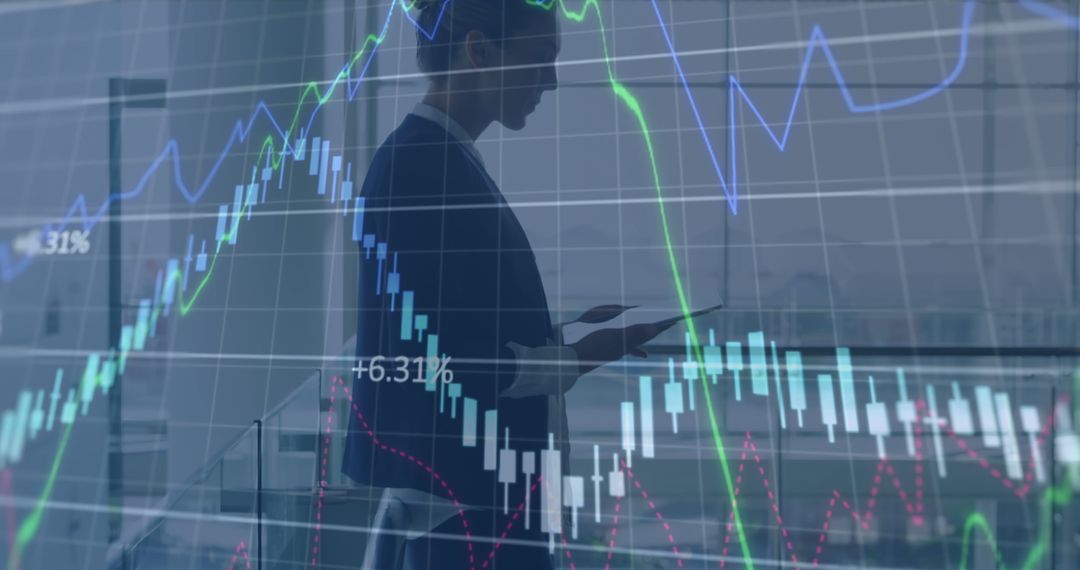
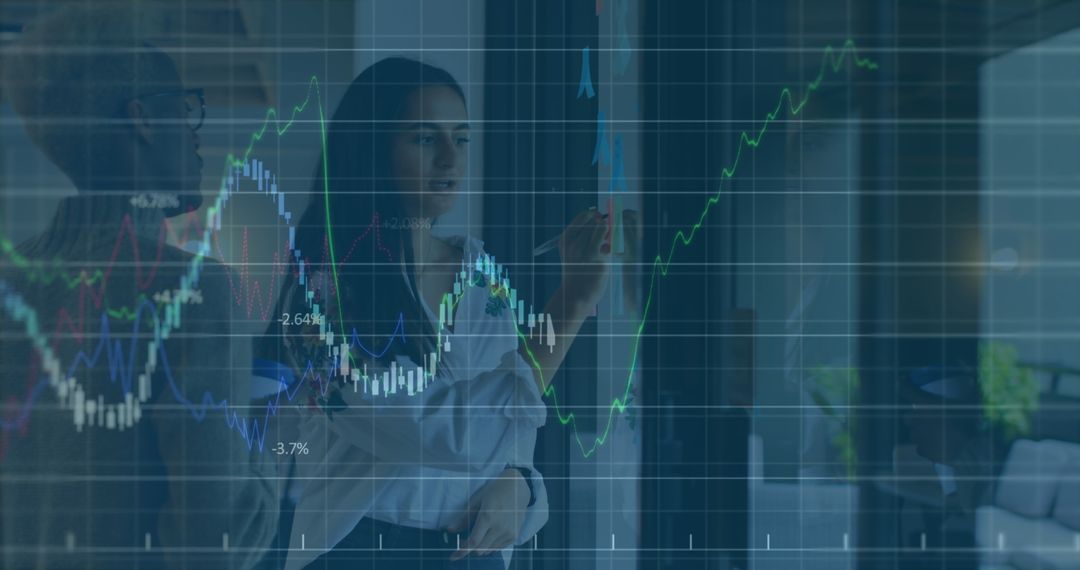
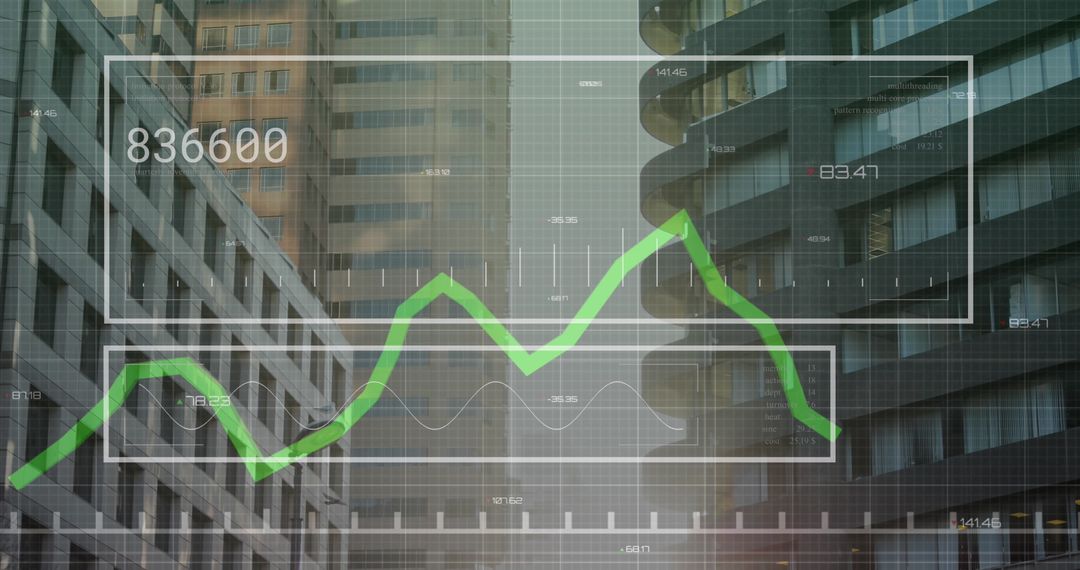
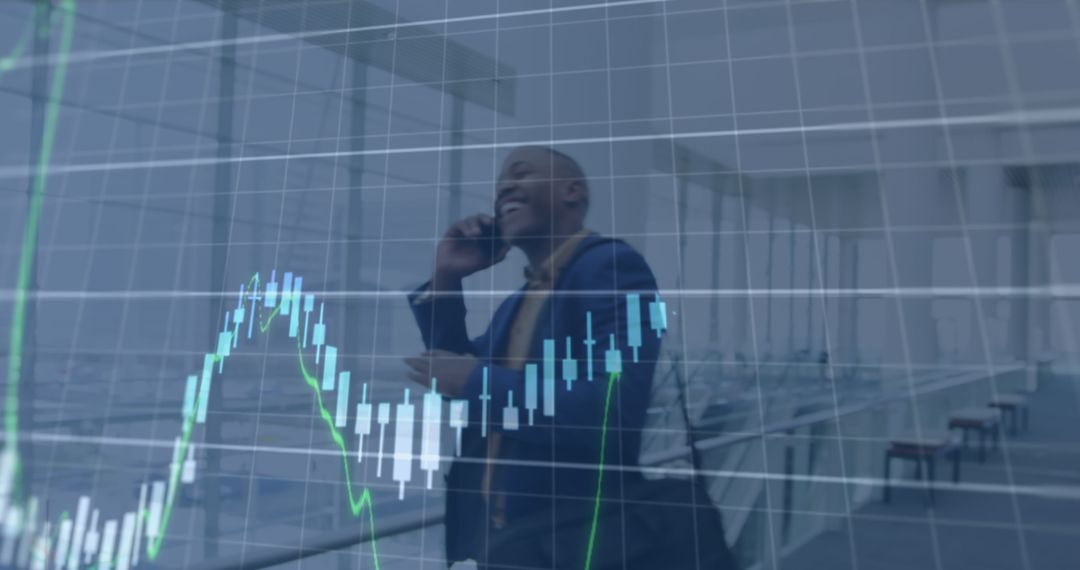
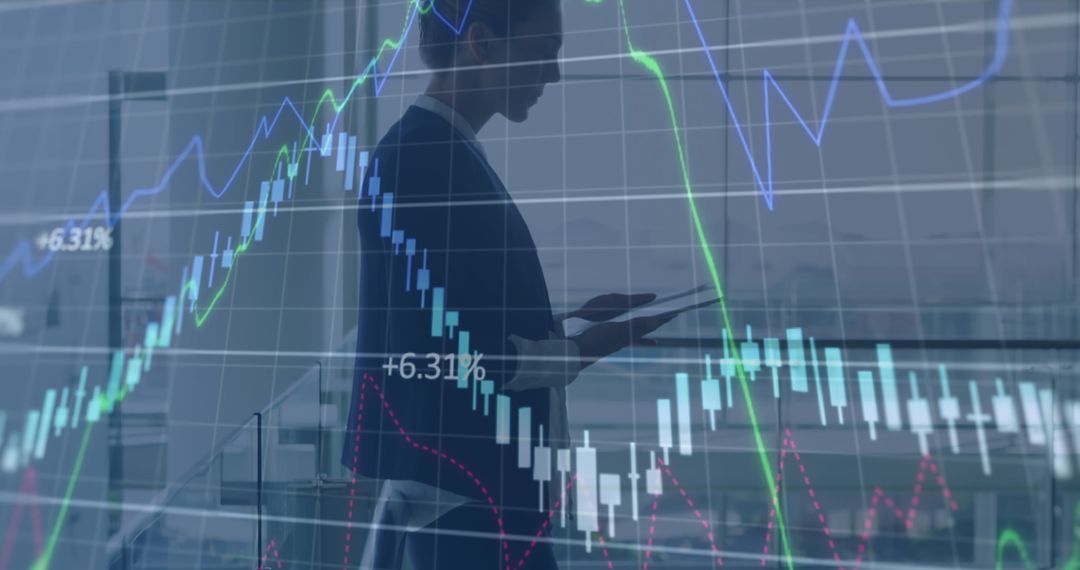
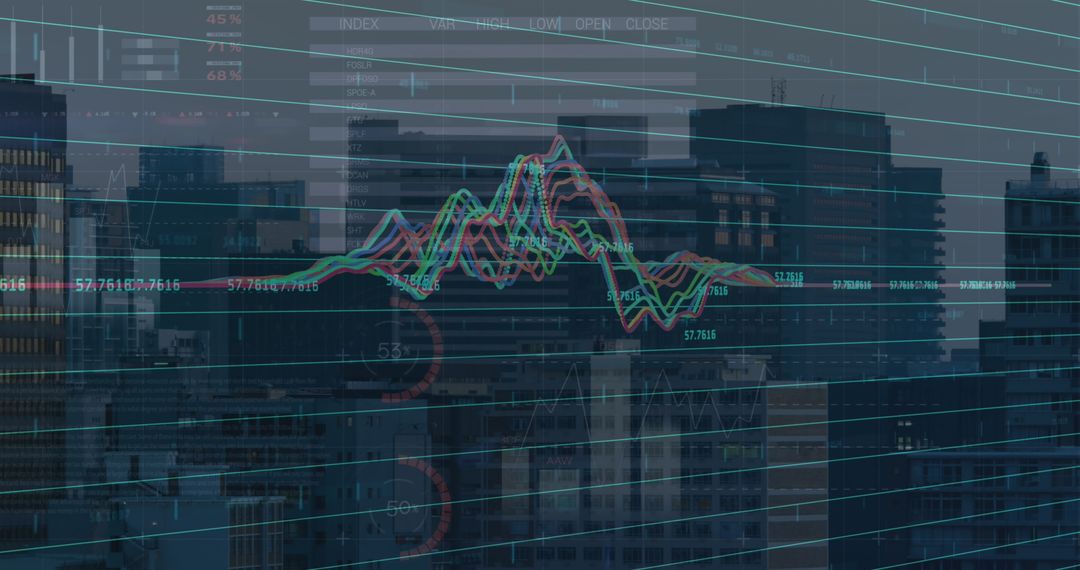
- Businessman Overlapping Financial Data Graph Bars, Analyzing Stock Market Trends
Businessman Overlapping Financial Data Graph Bars, Analyzing Stock Market Trends Image
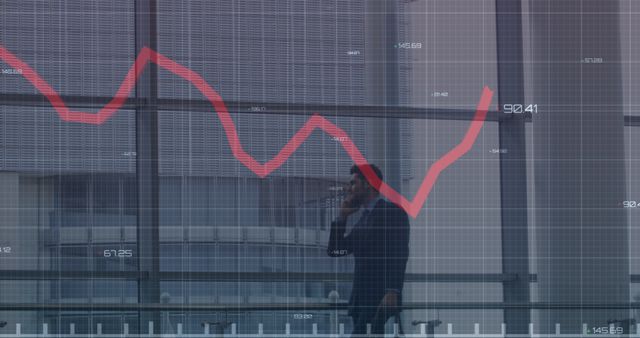
Silhouette of a businessman using a smartphone appears with transparent financial graphs and data overlaid. Image conveys themes of financial analysis, stock market trends, and modern business technology. Useful for articles about finance, blogs discussing economic trends, or corporate websites focusing on investment strategies.
Powered by  - Get 15% off with code: PIKWIZARD15


2
downloads
downloads
Tags:
More
Credit Photo
If you would like to credit the Photo, here are some ways you can do so
Text Link
photo Link
<span class="text-link">
<span>
<a target="_blank" href=https://pikwizard.com/photo/businessman-overlapping-financial-data-graph-bars-analyzing-stock-market-trends/b2ac131a15b99757e184be70eaf786c5/>PikWizard</a>
</span>
</span>
<span class="image-link">
<span
style="margin: 0 0 20px 0; display: inline-block; vertical-align: middle; width: 100%;"
>
<a
target="_blank"
href="https://pikwizard.com/photo/businessman-overlapping-financial-data-graph-bars-analyzing-stock-market-trends/b2ac131a15b99757e184be70eaf786c5/"
style="text-decoration: none; font-size: 10px; margin: 0;"
>
<img src="https://pikwizard.com/pw/medium/b2ac131a15b99757e184be70eaf786c5.jpg" style="margin: 0; width: 100%;" alt="" />
<p style="font-size: 12px; margin: 0;">PikWizard</p>
</a>
</span>
</span>
Free (free of charge)
Free for personal and commercial use.
Author: Authentic Images
Similar Free Stock Images

Premium


Premium


Premium


Premium


Premium


Premium


Premium


Premium


Premium

Premium


Premium


Premium


Premium


Premium

Premium
Premium


Premium


Premium


Premium

Premium


Premium


Premium


Premium


Premium