- Home >
- Stock Photos >
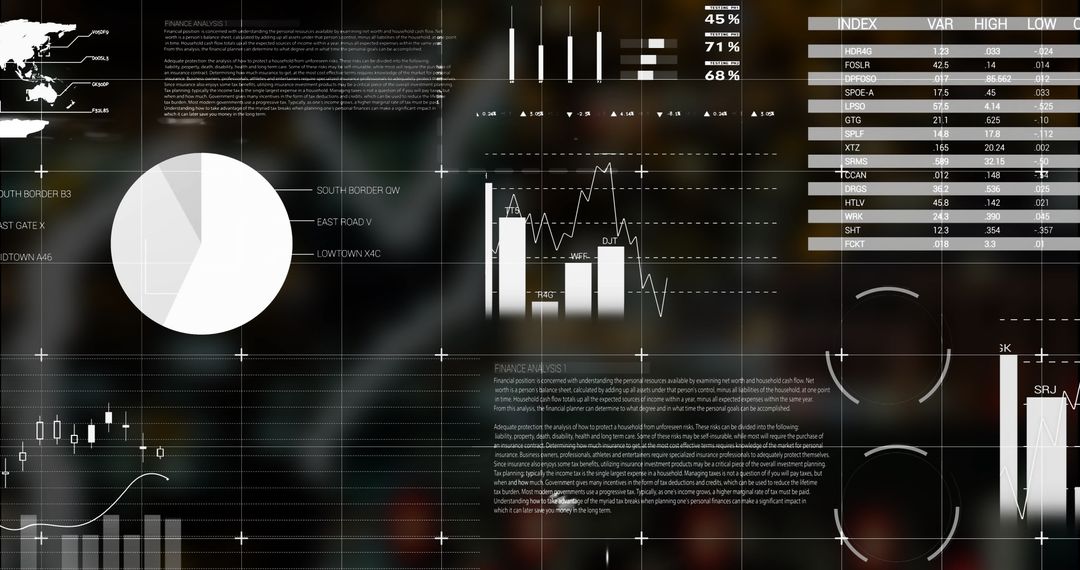
- Businesspeople Walking with Overlay of Financial Data and Graphs
Businesspeople Walking with Overlay of Financial Data and Graphs Image

Shot features diverse group of businesspeople walking with abstract overlay of financial data, graphs, and global economic charts. Illustrative of business collaboration, global commerce, and comprehensive economic analysis. Ideal for use in business presentations, articles on financial trends, fintech applications, or educational materials related to economic statistics and forecasting.
Powered by 


2
downloads
downloads
Tags:
More
Credit Photo
If you would like to credit the Photo, here are some ways you can do so
Text Link
photo Link
<span class="text-link">
<span>
<a target="_blank" href=https://pikwizard.com/photo/businesspeople-walking-with-overlay-of-financial-data-and-graphs/5ce84866d91458e7a231677a5e2cb509/>PikWizard</a>
</span>
</span>
<span class="image-link">
<span
style="margin: 0 0 20px 0; display: inline-block; vertical-align: middle; width: 100%;"
>
<a
target="_blank"
href="https://pikwizard.com/photo/businesspeople-walking-with-overlay-of-financial-data-and-graphs/5ce84866d91458e7a231677a5e2cb509/"
style="text-decoration: none; font-size: 10px; margin: 0;"
>
<img src="https://pikwizard.com/pw/medium/5ce84866d91458e7a231677a5e2cb509.jpg" style="margin: 0; width: 100%;" alt="" />
<p style="font-size: 12px; margin: 0;">PikWizard</p>
</a>
</span>
</span>
Free (free of charge)
Free for personal and commercial use.
Author: People Creations
Similar Free Stock Images

Premium


Premium


Premium


Premium


Premium


Premium


Premium


Premium


Premium


Premium


Premium


Premium


Premium


Premium


Premium


Premium


Premium


Premium


Premium


Premium


Premium


Premium


Premium


Premium