- Home >
- Stock Photos >
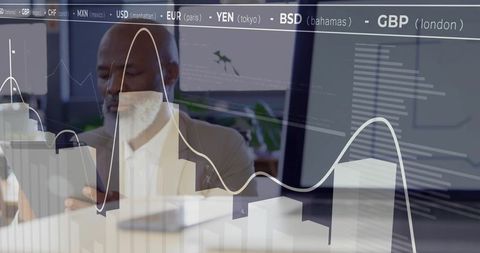
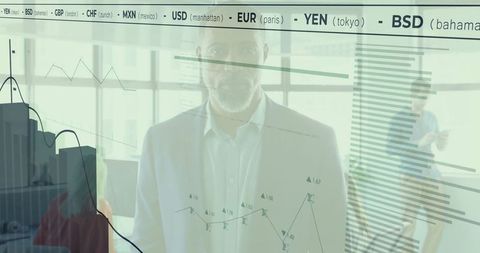
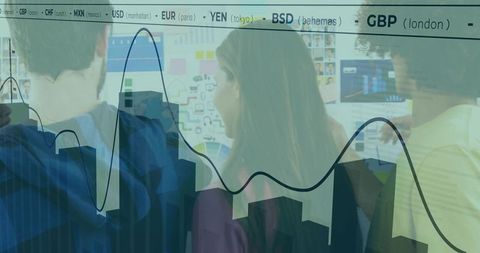
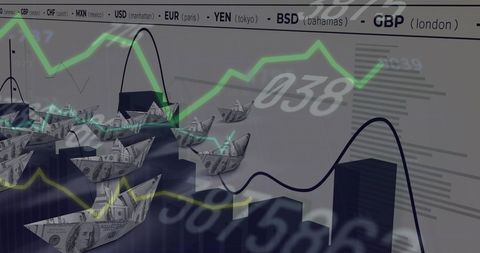
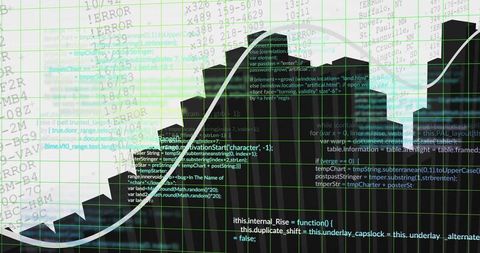
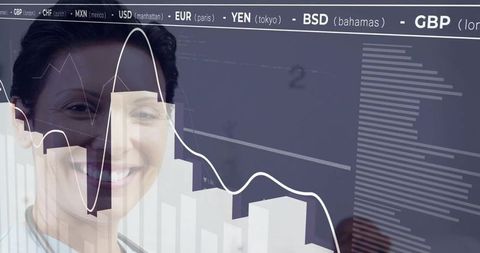
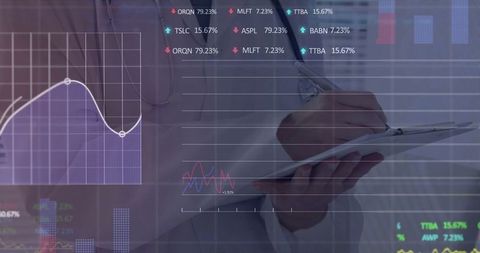
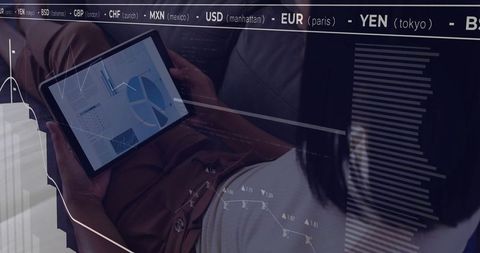
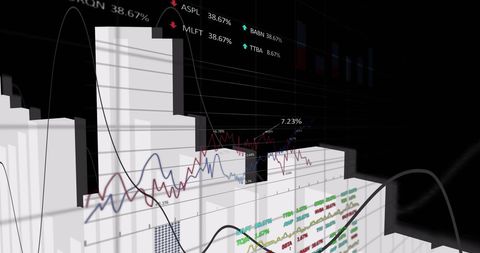
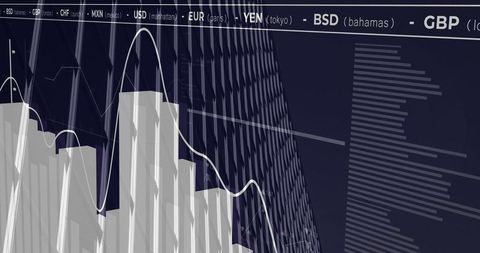
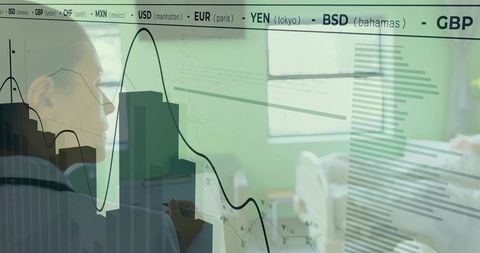
- Businessperson Analyzing Financial Data with Digital Currency Chart
Businessperson Analyzing Financial Data with Digital Currency Chart Image
Businessperson in a professional blazer recording insights on a clipboard, integrated with a digital overlay of various currency codes and analytical graphs. Symbolic representation of financial analysis and investment strategies. Useful for topics relating to global currencies, corporate strategy meetings, economic forecasting, and digital financial services.
Powered by 


0
downloads
downloads
Tags:
More
Credit Photo
If you would like to credit the Photo, here are some ways you can do so
Text Link
photo Link
<span class="text-link">
<span>
<a target="_blank" href=https://pikwizard.com/photo/businessperson-analyzing-financial-data-with-digital-currency-chart/af9a1a5b974bb4441e0491584a790a5b/>PikWizard</a>
</span>
</span>
<span class="image-link">
<span
style="margin: 0 0 20px 0; display: inline-block; vertical-align: middle; width: 100%;"
>
<a
target="_blank"
href="https://pikwizard.com/photo/businessperson-analyzing-financial-data-with-digital-currency-chart/af9a1a5b974bb4441e0491584a790a5b/"
style="text-decoration: none; font-size: 10px; margin: 0;"
>
<img src="https://pikwizard.com/pw/medium/af9a1a5b974bb4441e0491584a790a5b.jpg" style="margin: 0; width: 100%;" alt="" />
<p style="font-size: 12px; margin: 0;">PikWizard</p>
</a>
</span>
</span>
Free (free of charge)
Free for personal and commercial use.
Author: Creative Art
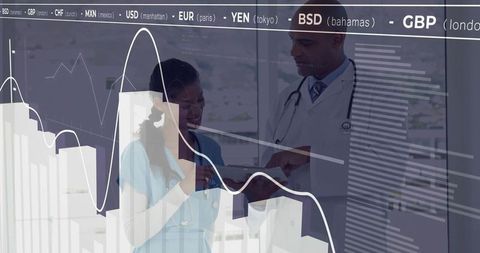
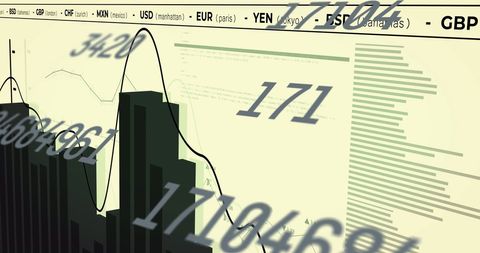
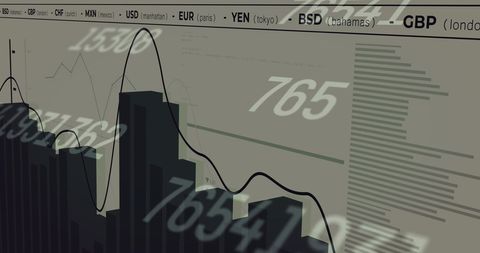
Similar Free Stock Images

Premium


Premium


Premium


Premium


Premium


Premium

Premium


Premium


Premium


Premium


Premium


Premium


Premium


Premium


Premium


Premium


Premium


Premium

Premium


Premium


Premium


Premium


Premium


Premium


Premium