- Home >
- Stock Photos >
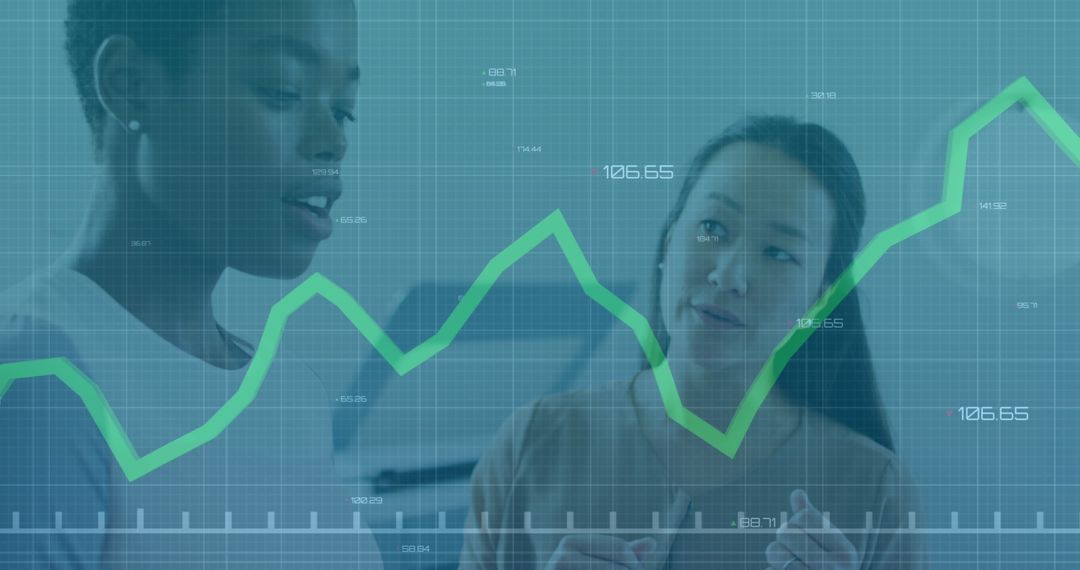
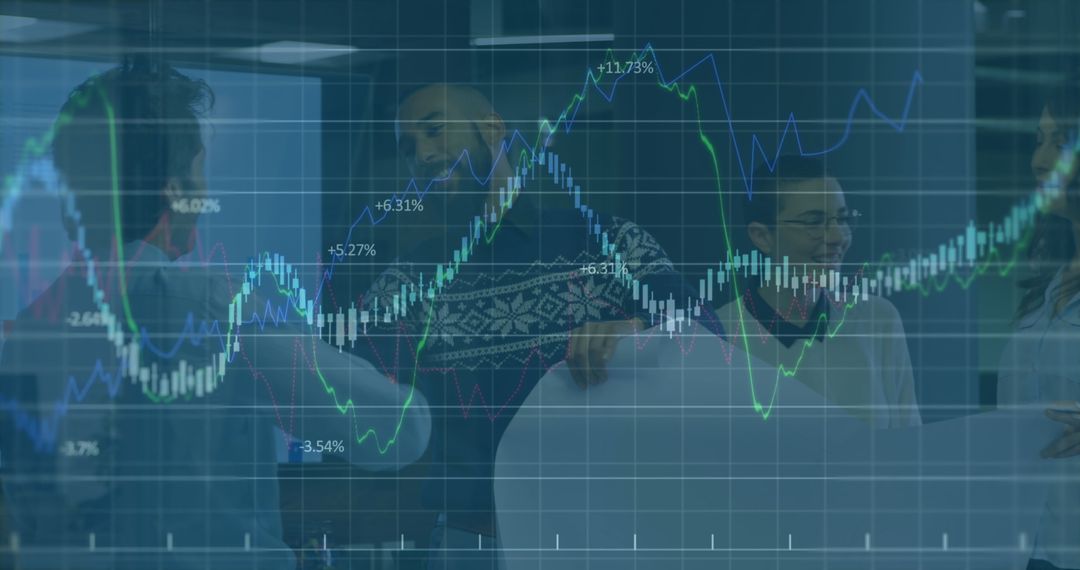
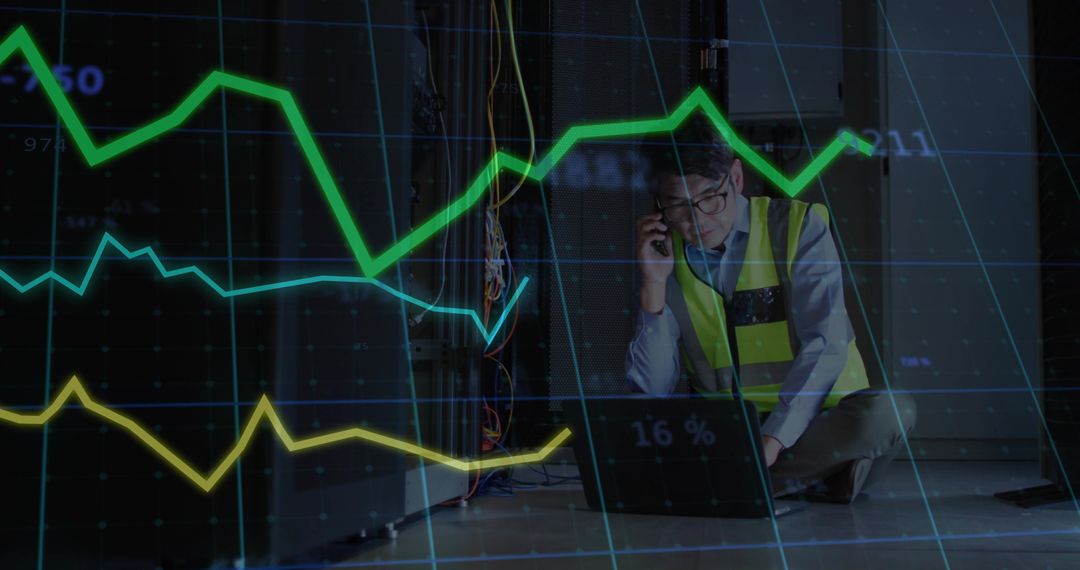
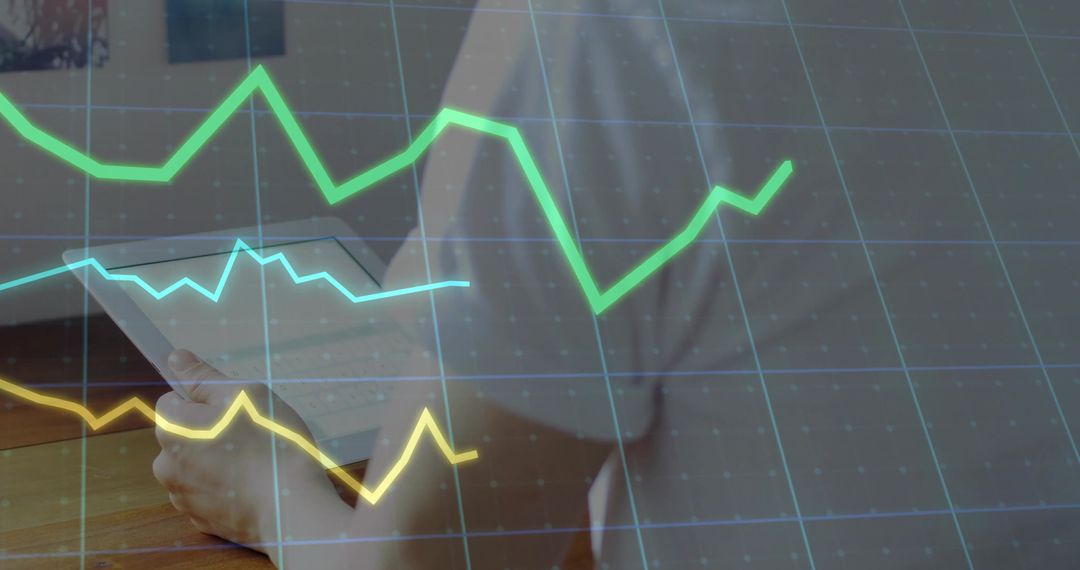
- Businesswoman Analyzing Financial Data with Graph Overlay Technology
Businesswoman Analyzing Financial Data with Graph Overlay Technology Image
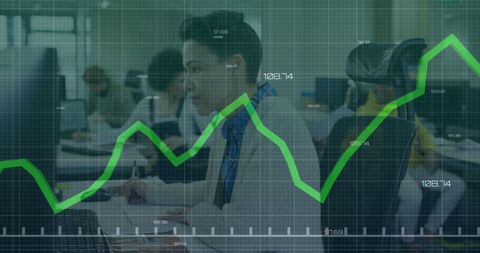
A woman in a modern office setting analyzing financial data depicted through a graph overlay on a computer interface. The scene conveys a focus on technological advancements in business analytical processes. This image is suitable for illustrating finance, data analysis, and business technology articles or presentations.
Powered by 


0
downloads
downloads
Tags:
More
Credit Photo
If you would like to credit the Photo, here are some ways you can do so
Text Link
photo Link
<span class="text-link">
<span>
<a target="_blank" href=https://pikwizard.com/photo/businesswoman-analyzing-financial-data-with-graph-overlay-technology/af5219ee818498f602513f7c7c3b04d8/>PikWizard</a>
</span>
</span>
<span class="image-link">
<span
style="margin: 0 0 20px 0; display: inline-block; vertical-align: middle; width: 100%;"
>
<a
target="_blank"
href="https://pikwizard.com/photo/businesswoman-analyzing-financial-data-with-graph-overlay-technology/af5219ee818498f602513f7c7c3b04d8/"
style="text-decoration: none; font-size: 10px; margin: 0;"
>
<img src="https://pikwizard.com/pw/medium/af5219ee818498f602513f7c7c3b04d8.jpg" style="margin: 0; width: 100%;" alt="" />
<p style="font-size: 12px; margin: 0;">PikWizard</p>
</a>
</span>
</span>
Free (free of charge)
Free for personal and commercial use.
Author: Creative Art
Similar Free Stock Images

Premium


Premium


Premium


Premium


Premium


Premium


Premium


Premium


Premium


Premium


Premium


Premium


Premium


Premium


Premium


Premium


Premium


Premium


Premium


Premium


Premium


Premium


Premium


Premium