- Home >
- Stock Photos >
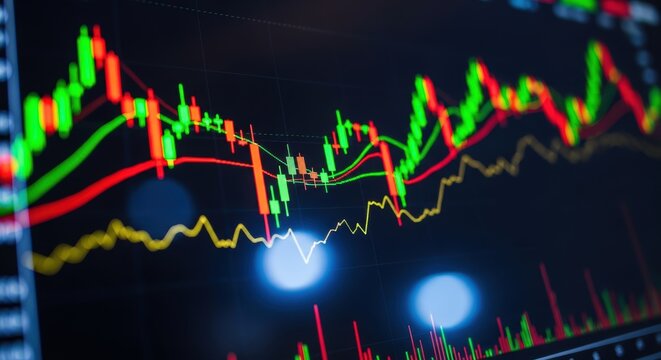
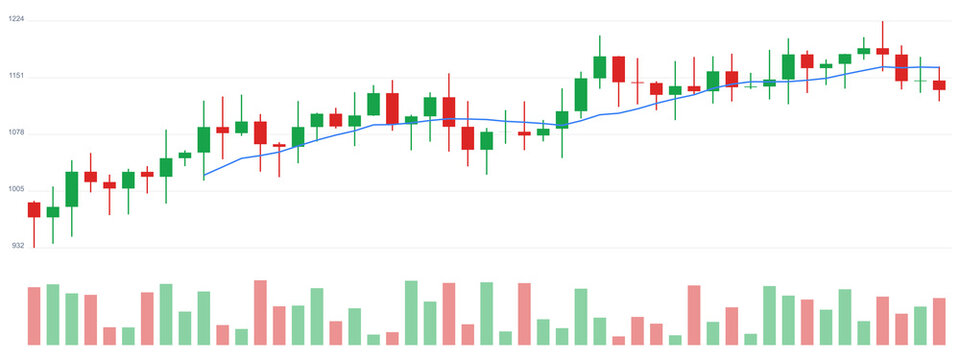
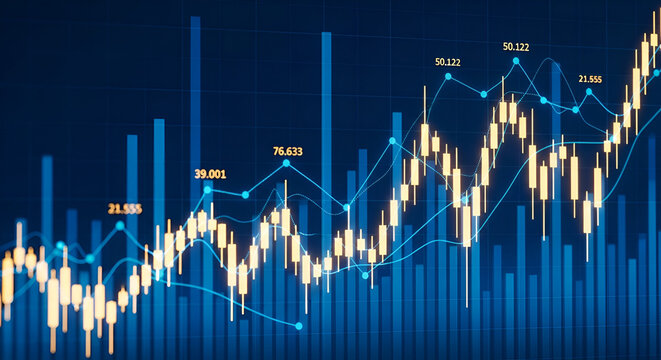
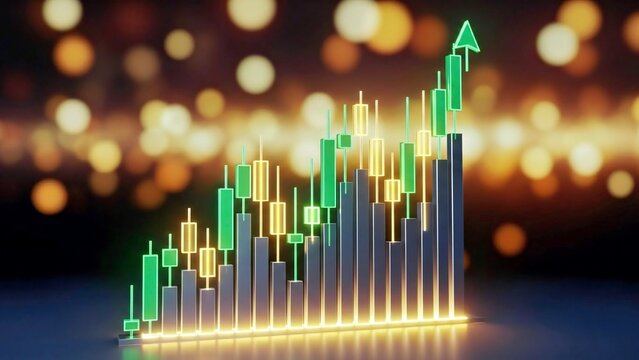
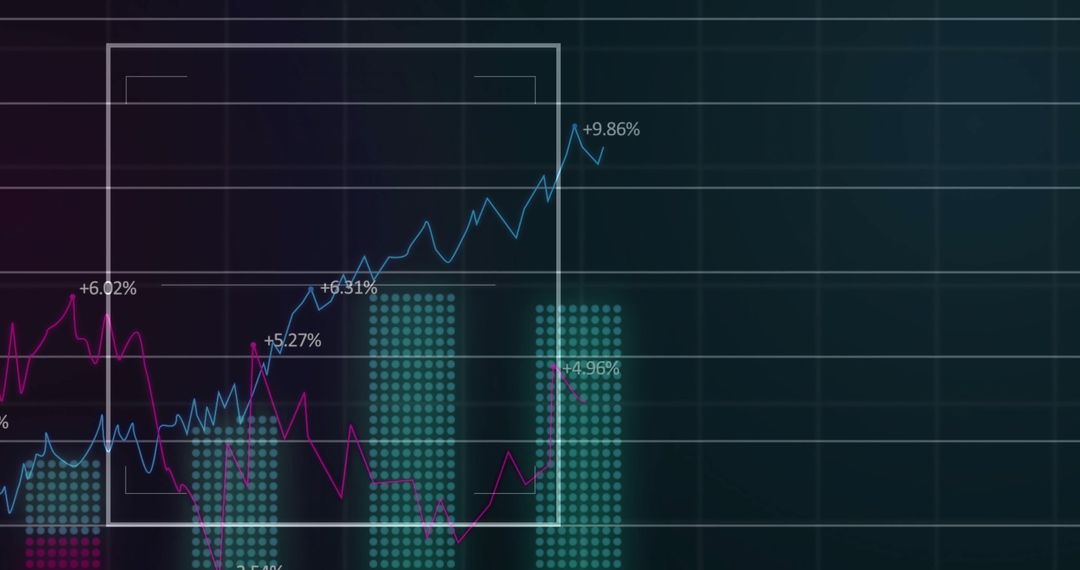
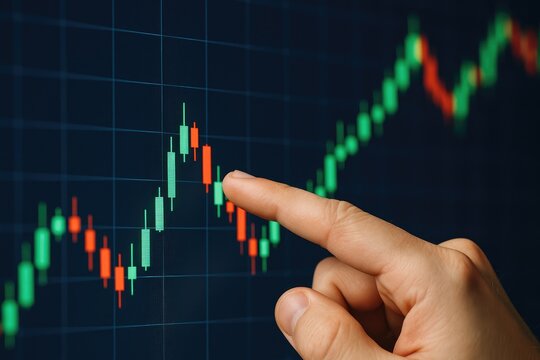
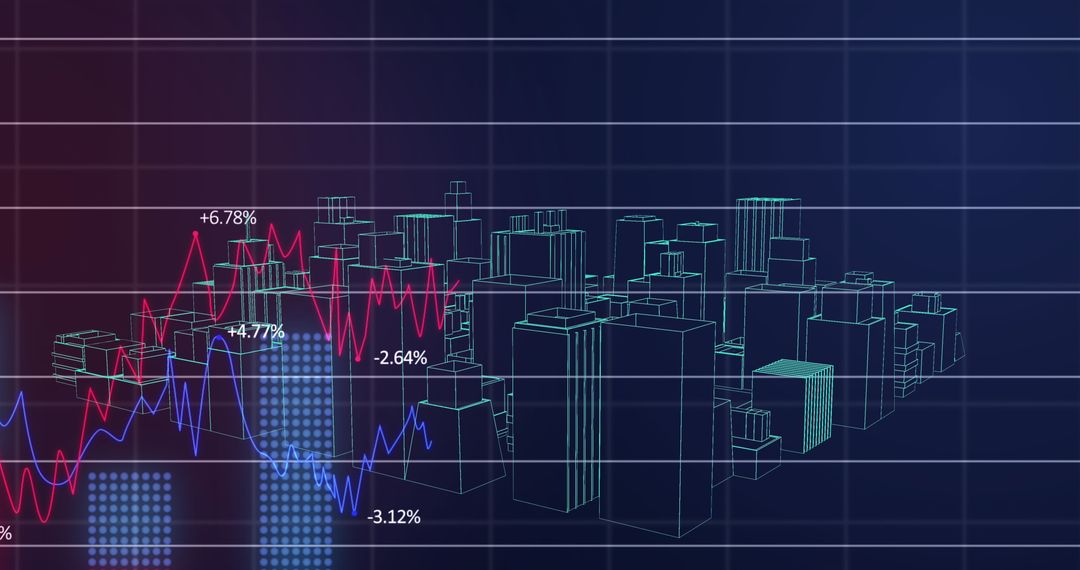
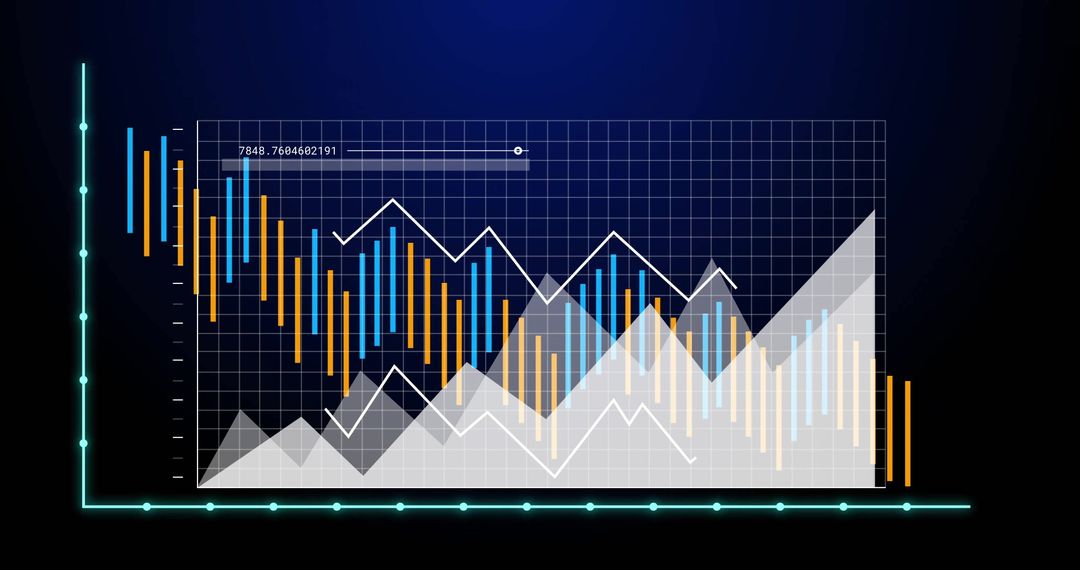
- Candlestick Chart Visualization with Indicators and Growth Highlight
Candlestick Chart Visualization with Indicators and Growth Highlight Image

This digital graphic showcases a detailed candlestick chart with red and green bars indicating market movements. Key financial indicators are highlighted with distinctive patterns such as blue dots and a growth percentage of +2.1%. Ideal for use in financial reports, investment presentations, and trading tutorials to illustrate market analysis, performance trends, and investment results.
Powered by 


0
downloads
downloads
Tags:
More
Credit Photo
If you would like to credit the Photo, here are some ways you can do so
Text Link
photo Link
<span class="text-link">
<span>
<a target="_blank" href=https://pikwizard.com/photo/candlestick-chart-visualization-with-indicators-and-growth-highlight/467fe783496898858b90f5e6aa0142b3/>PikWizard</a>
</span>
</span>
<span class="image-link">
<span
style="margin: 0 0 20px 0; display: inline-block; vertical-align: middle; width: 100%;"
>
<a
target="_blank"
href="https://pikwizard.com/photo/candlestick-chart-visualization-with-indicators-and-growth-highlight/467fe783496898858b90f5e6aa0142b3/"
style="text-decoration: none; font-size: 10px; margin: 0;"
>
<img src="https://pikwizard.com/pw/medium/467fe783496898858b90f5e6aa0142b3.jpg" style="margin: 0; width: 100%;" alt="" />
<p style="font-size: 12px; margin: 0;">PikWizard</p>
</a>
</span>
</span>
Free (free of charge)
Free for personal and commercial use.
Author: Authentic Images
Similar Free Stock Images

Premium


Premium


Premium


Premium


Premium


Premium


Premium


Premium


Premium


Premium


Premium


Premium


Premium


Premium


Premium


Premium


Premium


Premium


Premium


Premium


Premium


Premium


Premium


Premium