- Home >
- Stock Photos >
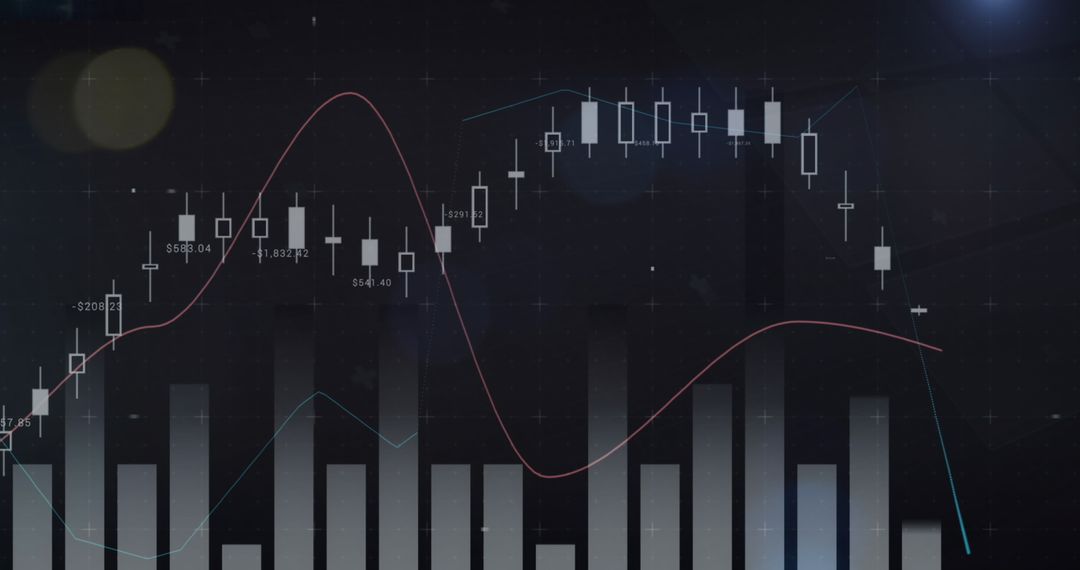
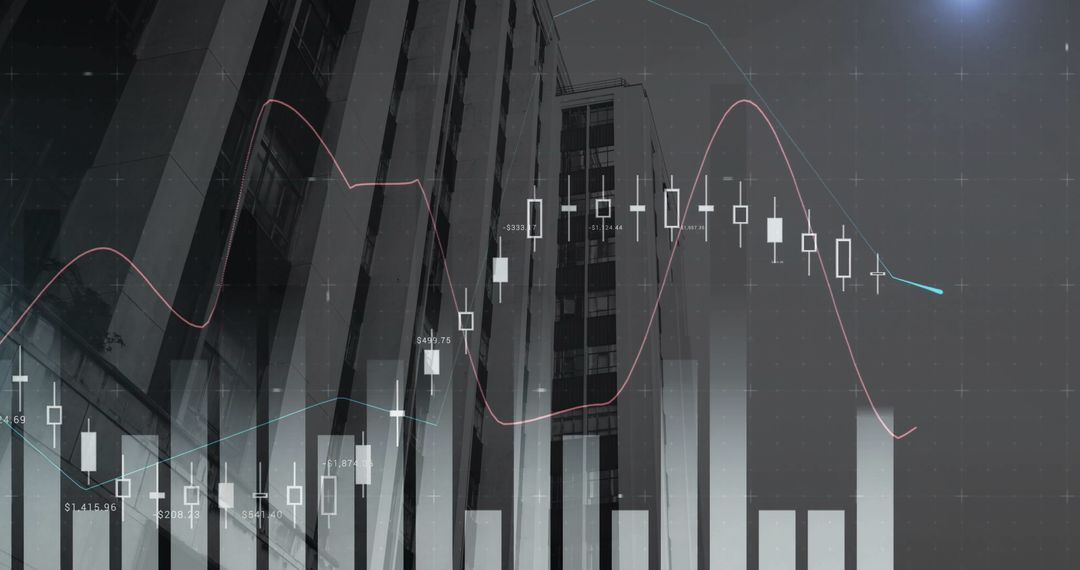
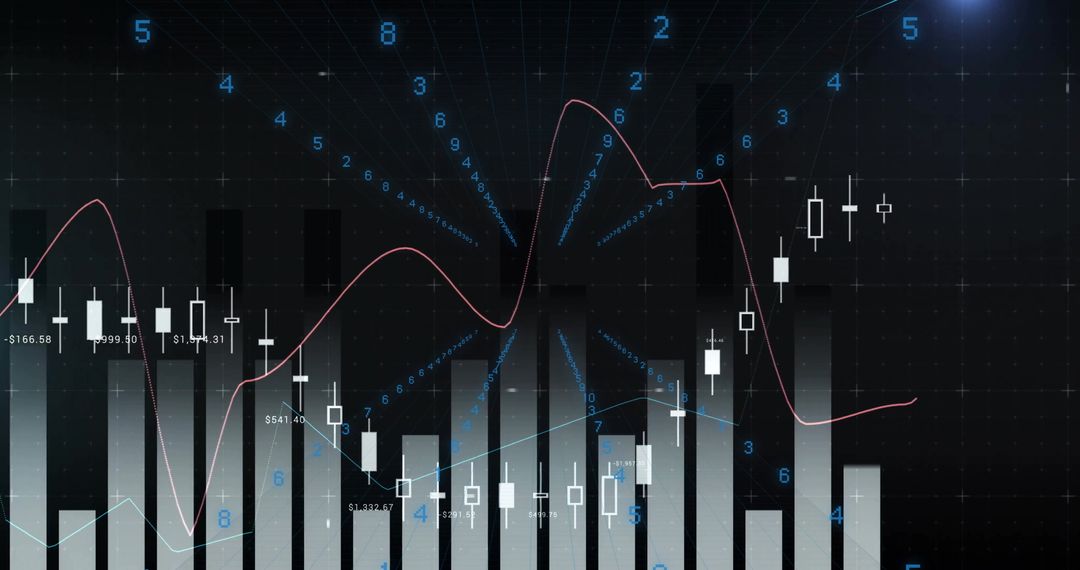
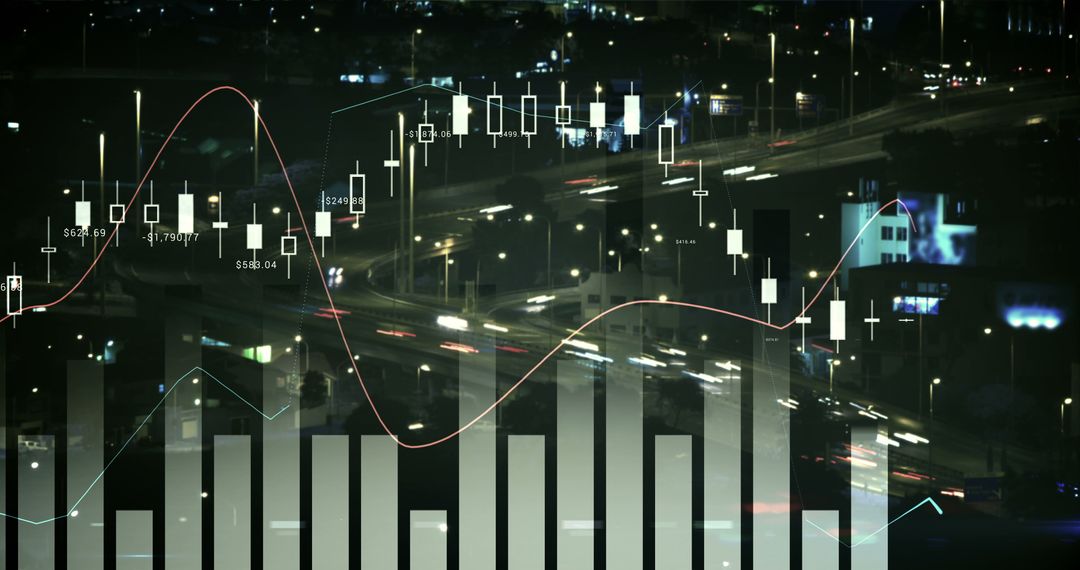
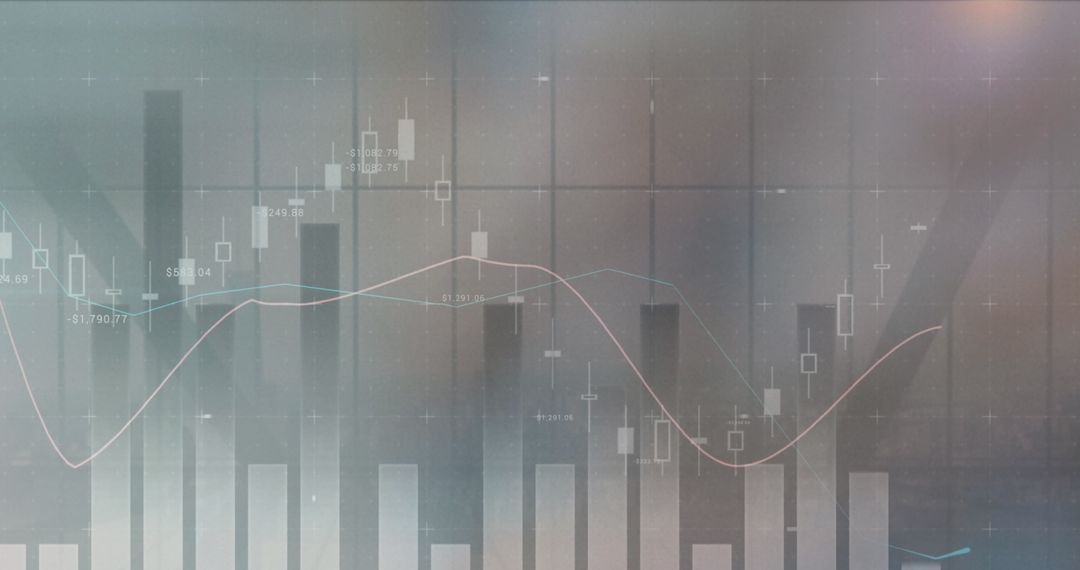
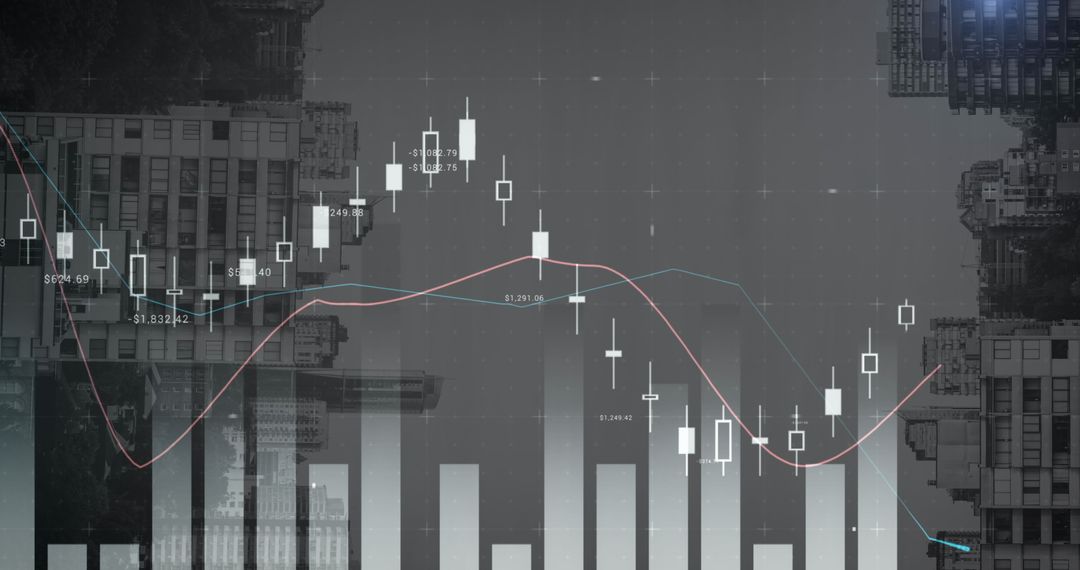
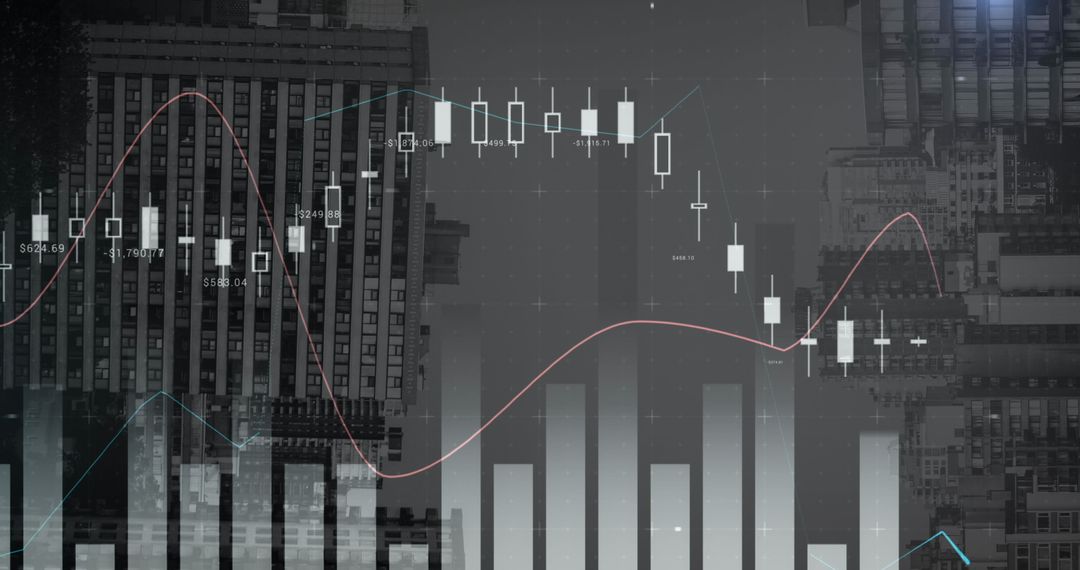
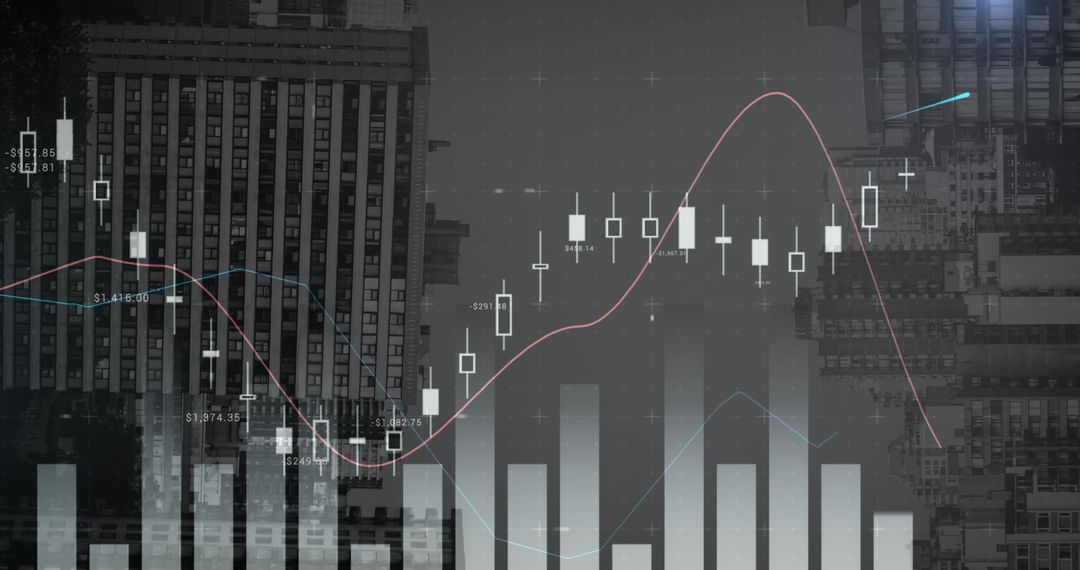
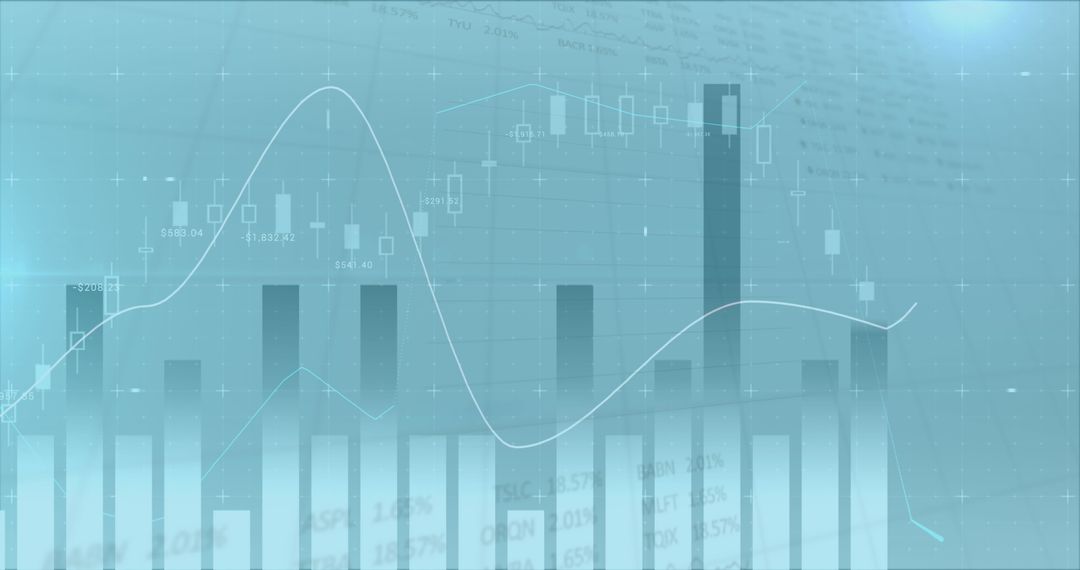
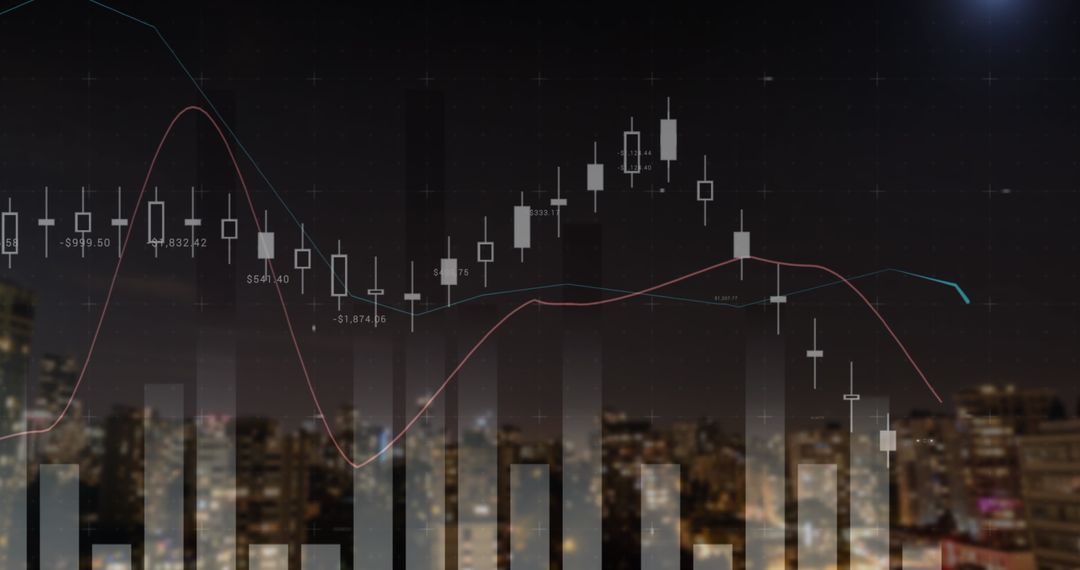
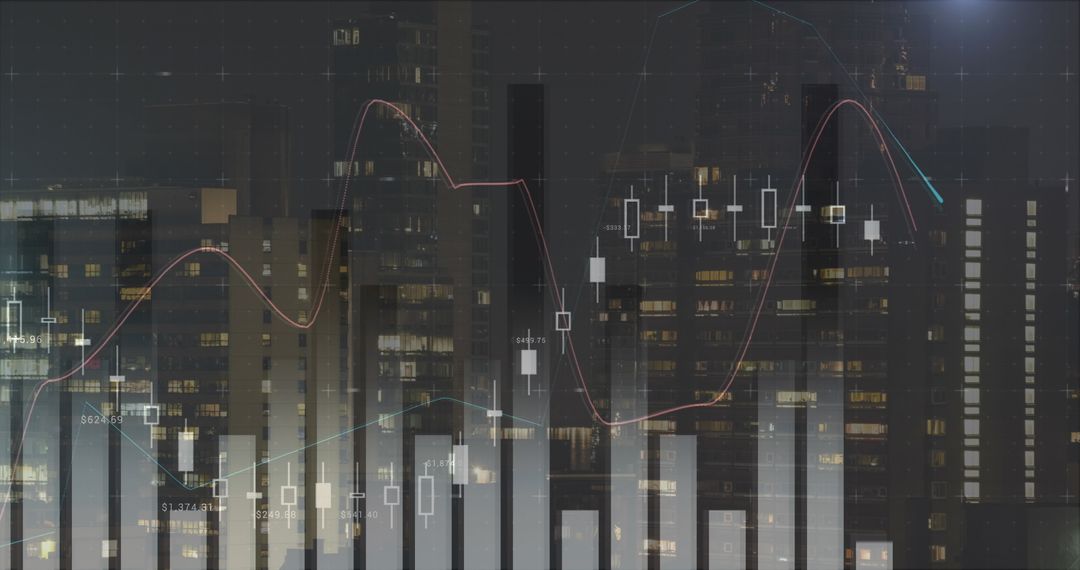
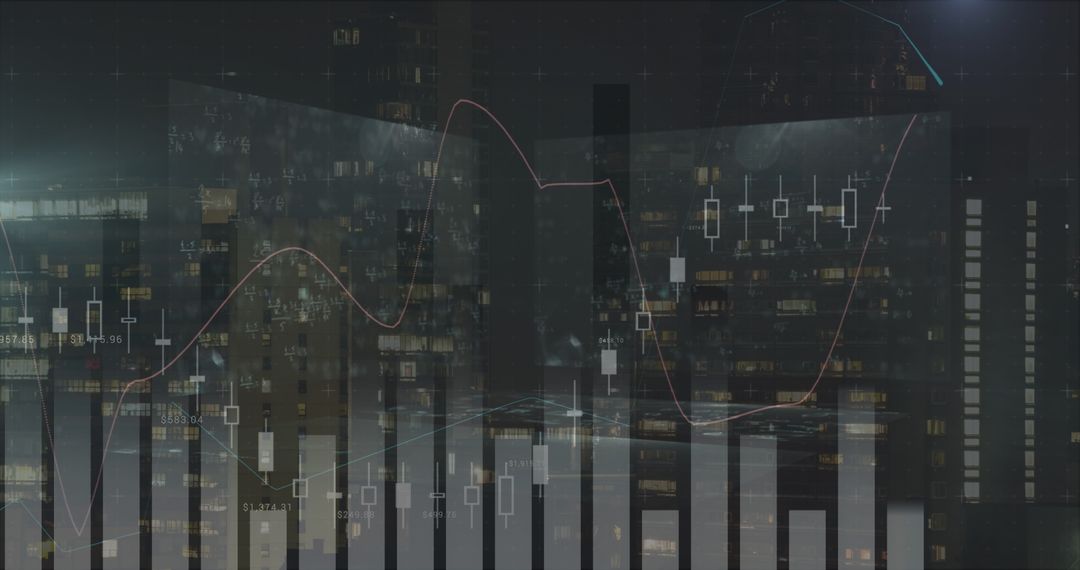
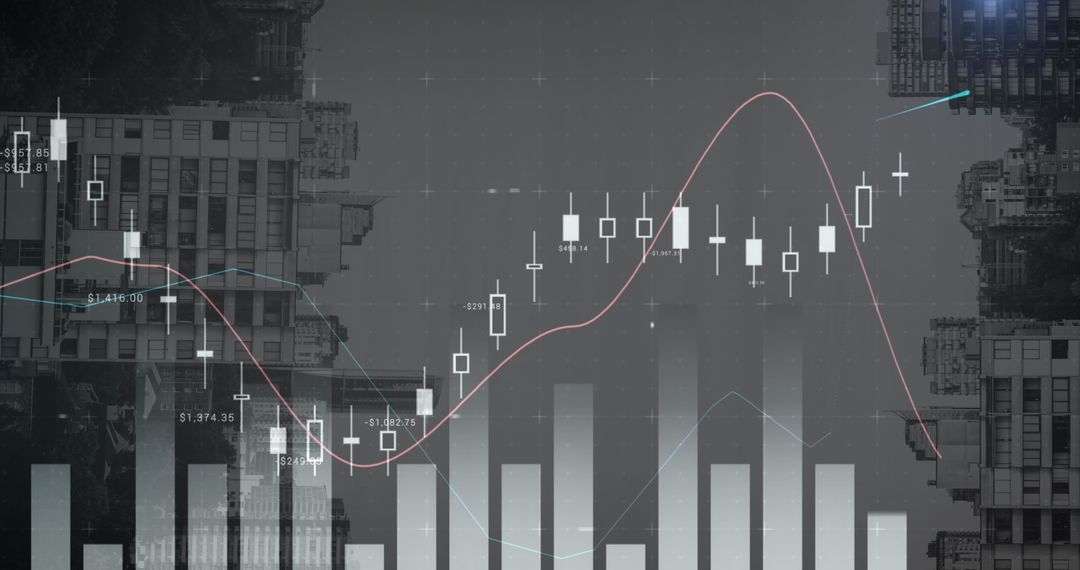
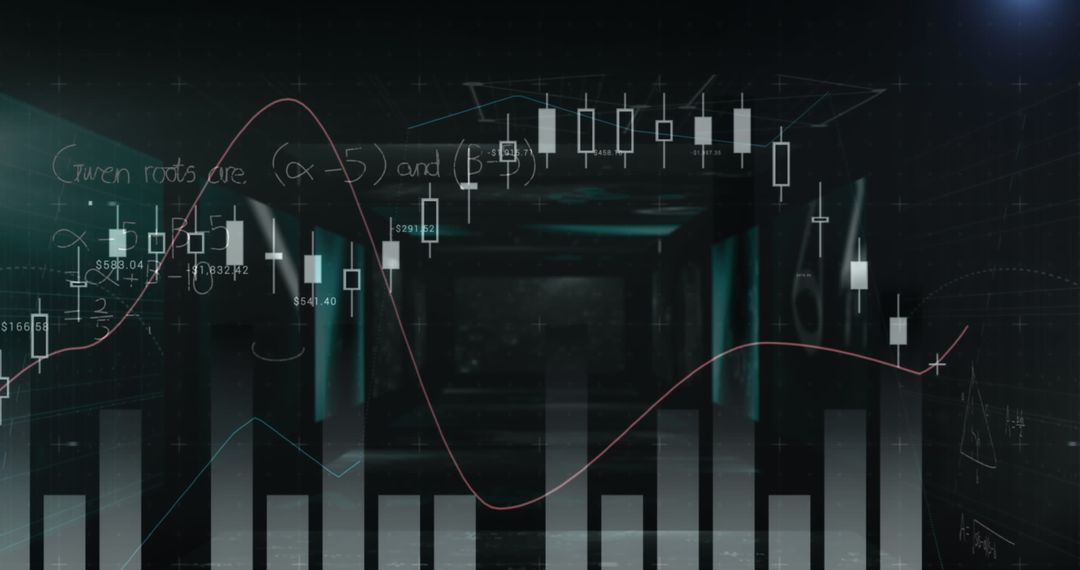
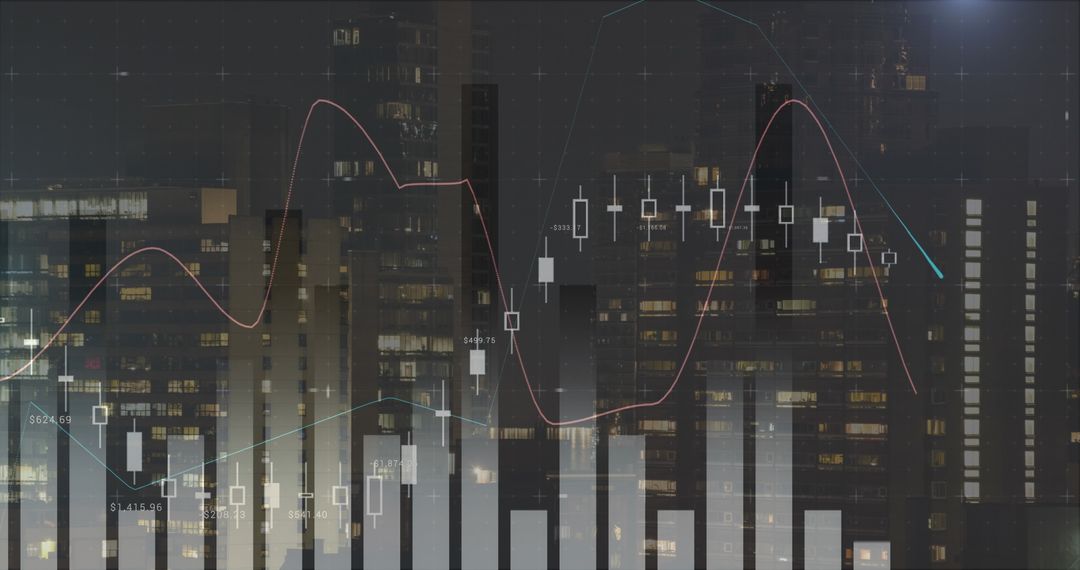
- Candlestick Charts with Moving Averages over Cityscape
Candlestick Charts with Moving Averages over Cityscape Image
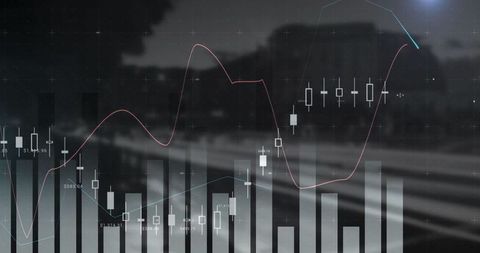
Combining modern data visualization with cityscape, this design illustrates financial analysis using candlestick charts and moving averages. Perfect for content related to stock market strategies, investment trends, and economic forecasting, this can be used for web design, financial newsletters, or business presentation backgrounds.
Powered by 


0
downloads
downloads
Tags:
More
Credit Photo
If you would like to credit the Photo, here are some ways you can do so
Text Link
photo Link
<span class="text-link">
<span>
<a target="_blank" href=https://pikwizard.com/photo/candlestick-charts-with-moving-averages-over-cityscape/90efc379de0af172e9117e11f4ce40e1/>PikWizard</a>
</span>
</span>
<span class="image-link">
<span
style="margin: 0 0 20px 0; display: inline-block; vertical-align: middle; width: 100%;"
>
<a
target="_blank"
href="https://pikwizard.com/photo/candlestick-charts-with-moving-averages-over-cityscape/90efc379de0af172e9117e11f4ce40e1/"
style="text-decoration: none; font-size: 10px; margin: 0;"
>
<img src="https://pikwizard.com/pw/medium/90efc379de0af172e9117e11f4ce40e1.jpg" style="margin: 0; width: 100%;" alt="" />
<p style="font-size: 12px; margin: 0;">PikWizard</p>
</a>
</span>
</span>
Free (free of charge)
Free for personal and commercial use.
Author: People Creations
Similar Free Stock Images

Premium


Premium


Premium


Premium


Premium


Premium


Premium


Premium


Premium


Premium


Premium


Premium


Premium


Premium


Premium


Premium


Premium


Premium


Premium


Premium


Premium


Premium


Premium


Premium