1. Home > 
  2. Stock Photos > 
  3. Chalkboard Soccer Field Diagram Strategy Concepts

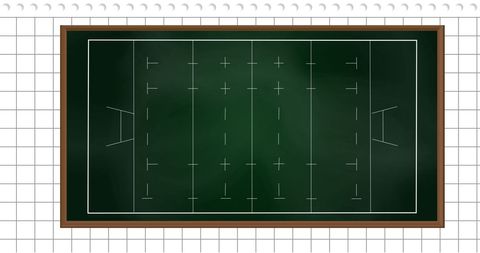
Chalkboard Soccer Field Diagram Strategy Concepts Image

Chalkboard Soccer Field Diagram Strategy Concepts

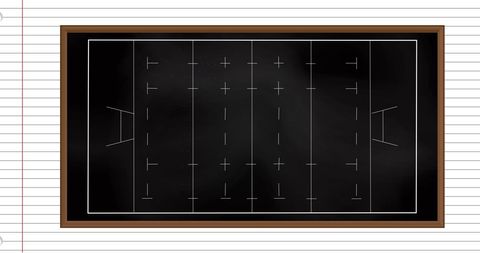
Simple diagram of a soccer field drawn on a chalkboard, representing planning and strategy concepts. Useful for illustrating coaching tactics, sports education materials, or interactive coaching manuals.

Powered by Shutterstock logo - Get 15% off with code: PIKWIZARD15
close up of a chalkboard with soccer strategy - Powered by Shutterstock - Get 15% off with code: PIKWIZARD15Coach drawing a football game tactics with white chalk on blackboard. Soccer coach explaining game strategy. - Powered by Shutterstock - Get 15% off with code: PIKWIZARD15Man drawing a soccer game strategy with white chalk on a blackboard. - Powered by Shutterstock - Get 15% off with code: PIKWIZARD15American football, concept of Super Bowl and American football - Powered by Shutterstock - Get 15% off with code: PIKWIZARD15A soccer ball lies on the field next to a clipboard with plays, amidst digital analytics displays, blending sports strategy with tech insights. - Powered by Shutterstock - Get 15% off with code: PIKWIZARD15

Credit Photo

If you would like to credit the Photo, here are some ways you can do so

Free (free of charge)

Free for personal and commercial use.

Author: People Creations

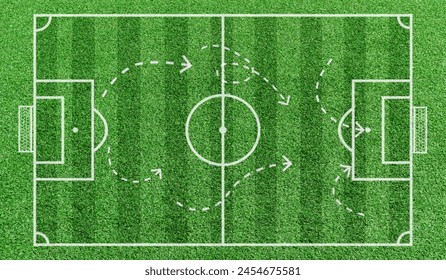
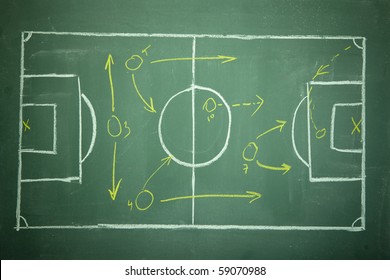
Similar Free Stock Images

Futuristic Digital Interface with Scanning Grid
Premium
Grass field with soccer tactic, Football strategy in stadium field top view.
Financial Data Graph Rendering Global Market Trends
Dynamic Financial Graph with Violet Background Concept
Falling Line Graph on Navy Background Illustrating Economic Decline
Rising Digital Graph and Data Visualizations on Black Background
Premium
Soccer game strategy drawn with white chalk on a blackboard.
Digital Financial Dashboard with Graphs and Data Visualization
Innovative Data Analysis with Dynamic Line Graph and Digital Elements
Abstract Financial Chart Background with Bar and Line Graphs
Futuristic Graph and Data Visualization Interface Design
Premium
Soccer - Football Strategy planning on black (green) board
Dynamic Financial Charts and Graphs Indicating Market Trends
Futuristic Display with Data Scan and Holographic Elements
Retro Neon Synthwave Digital Arena with Grid Lines
Digital Financial Data Analysis with Infographics and Charts
Premium
Ball; Whistle And Soccer Tactic Diagram On Paper Over Pitch
Digital Finance Chart Overlaying Globe Background
Futuristic Global Finance Chart with Rotating Globe Animation
Rising Financial Data Graph on Digital Grid Background
Abstract Digital Interface with Mathematical Equations and Graphs on Black Background
Premium
Displaying wicker basket holding soccer balls on turf pitch, with field tactics diagram, copy space. Sports equipment, coaching, strategic planning, athletic training, outdoor recreation, minimalistic
Data Visualization on Security Shield Interface for Cyber Security
Financial Data Analysis Vibrant Graphs on Blue Background
Interactive Social Media Metrics Overlaid on Business Data Graph
Futuristic Dashboard Interface with Digital Hologram and Coding Elements
Premium
football manager tactics , soccer instruction , game plan schema
Digital Interface Visualizing DNA and Data Patterns
Digital Visualization of Global Networking with Statistical Graphs
Abstract Visualization of Data Analytics Dashboard with Speech Bubbles
Data Visualization with Line Charts and Cyberspace Interface
Premium
Football tactics
Digital Green Economy Data Visualization with Floating Numbers
Dynamic Digital Data Analysis on Elevated Grid
Premium

soccer game strategy hand drawn in chalk on a blackboard
Futuristic Financial Graph on Purple Retro Background
Digital Financial Data Analyzing Over Circular Grid Display
Futuristic Digital Interface with Spiraling Coding Patterns
Data Analytics and Financial Growth Indicators
Premium
Sport soccer football tactics strategy simple icon on background on black chalkboard.
Black Background with Grid Pattern for Digital Design
Digital Data Visualization with Blue Grid and Timeline
Financial Data Line Graph on Digital Display
Optimized Statistical Data Overlain on Corporate Architecture
Premium
Football play strategy drawn out on a chalk board
Futuristic Digital Network Interface With Interactive Wave Patterns
Abstract Financial Graphs on Dynamic Digital Interface
Dynamic Financial Growth Digital Chart Display
Abstract Digital Finance Chart Showing Fluctuating Graph Lines
Premium
green blackboard with a drawing of a blank Football field
Colorful Data Visualization on Dark Background
Dynamic Financial Data Visualization on Digital Grid Background
Abstract Digital Charts with Social Media Metrics Rising
Digital Data Visualization on Blue Background
Premium
drawing tactic scheme at frame on brick wall
NFT Financial Data Visualization with Digital Graph Overlay
Cityscape with Digital Stock Market Graphs and Statistics
Dynamic Red Line Graph With Data Points on Gridded Background
Abstract Representation of Financial Data Processing
Premium
football tactic analysis with graph , soccer sport information report for manager
Digital Data Processing with Chart in Futuristic Interface
Minimalist Financial Chart Display on Digital Interface with Gold Frame
Mathematical Equations with Graph and Illustrations on Whiteboard
Futuristic Digital Interface with DNA and Brain Diagrams
Digital Data Processing with Scope Scanning Interface
Financial Data Flow against Urban Skyline Backdrop
Premium
Soccer tactics. Set Of Tactic icons. Tactics business concept icons. Vector Illustration. Eps 10.
Digital Financial Data Display with Graph and Grid
Digital Interface Showing Global Business Data Analytics
Digital Finance: Modern Stock Market Analysis Display
Digital Financial Display with Graphs and Data Analysis
Premium
Chalkboard showing soccer strategy featuring black background. Diagram including arrows and player positions, indicating movement and tactics, fills board
Digital Data Analysis with Green Line Graph on Grid Background
Digital Financial Data with Graph and Grid Patterns
Financial Graph Analysis on Green Grid Background
Digital Data Network with Dynamic Connections
Premium
American football, concept of Super Bowl and American football strategy and tactic from the coach on a chalkboard.
Futuristic Financial Data Visualization on Digital Interface
Data Analytics Graphs on Digital Interface Background
Dynamic Financial Data Visualizations on Grid Interface
Digital Data Visualization with Trend Lines and Percentage Changes
Premium
Football coach grouping and guiding to his team during a team meeting in a school tournament. Game plan diagram showing each player’s position and movement as a team talk before game starts.
Sports Strategy Chalkboard with Diagrams on Grid Background
Futuristic Data Visualization and Graph Analytics on Green Interface
Futuristic Keyboard Analytics Display with Digital Graphs and Numbers
Digital Data Flow with Infographics Hologram
Premium
Game strategy drawn with white chalk on a blackboard.
Line Graph Illustrating Data Trend on Green Digital Background
Green Line Graph with Data Points on Grid Background
Green Line Graph on Dark Digital Grid
Futuristic Digital Representation of DNA Strand
Premium
Soccer Tactics Illustrated on a Chalkboard with Hand Drawing
Futuristic Data Visualization with Dynamic Graphs and Digital Globe
Orange Step Chart Crossing Dark Blue Grid with Neon Axes and Data Callouts
Graph Lines Portraying Financial Data Trends
Football Game Plan Strategy Displayed on Blackboard
Data Recovery Progress Display on Digital Interface
Dynamic Line Chart with Histogram on Digital Grid Background
Premium
Scheme of football game on chalkboard background
Digital Interface with Global Financial Graphs Background
Financial Graph and Waves Representing Market Trends and Data
Fluctuating Digital Stock Market Data Chart
Analyzing Accelerating Data Trends on Grid with Tech Insights
Premium
Chalkboard with scheme of football game. Team play and strategy
Abstract Financial Graph with Rising Waves on Red Gradient
Futuristic Graph with Digital Globe Symbolizing Global Technology Connections
Analyzing Data Trends on Digital Graph Interface
Futuristic Digital Interface with Scanning Data Dashboards
Premium
Football tactic education. Coach explains the strategy of the game
Retro Video Display with Digital Interference Effect
Dynamic Business Data and Cityscape Visualization
Data Analysis with Advanced Technology Interface Details Profusion
Rising Graph Line on Digital Green Grid Background
Premium
Group of teenage boys discussing sports strategy while pointing at digital tablet displaying play diagram outdoors, focusing on teamwork and planning during practice session
Dynamic Green Line Graph Depicting Financial Data
Holographic Financial Data Visualization with Stock Trends
Digital Financial Data and AI Illustration Networking Globally
Dynamic Financial Graphs Overlaying Modern Cityscape
Premium
football tactic analysis with graph , soccer sport information report for manager
Dynamic Financial Data Overlaid on Grid Background
Digital Graphs and Data Visualization on Green Background
Abstract Digital DNA Helix with Geometric Patterns and Nodes
Futuristic Data Graph with Currency and Digital Overlay
Premium
soccer coach drawing strategy plan
Monochrome Financial Dashboard Showing Growth Trend with Green Line and Dot Bars