- Home >
- Stock Photos >
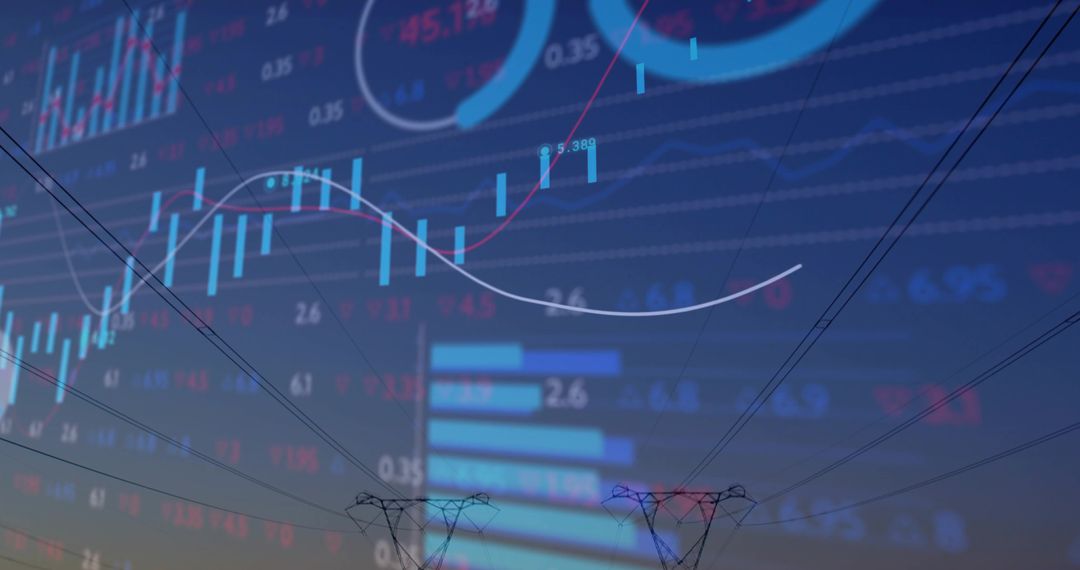
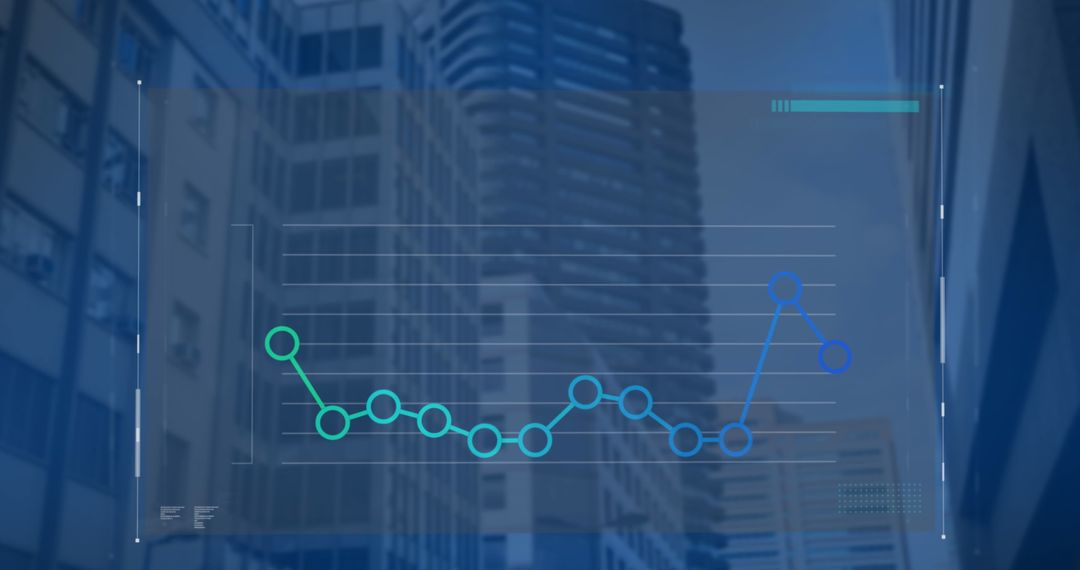
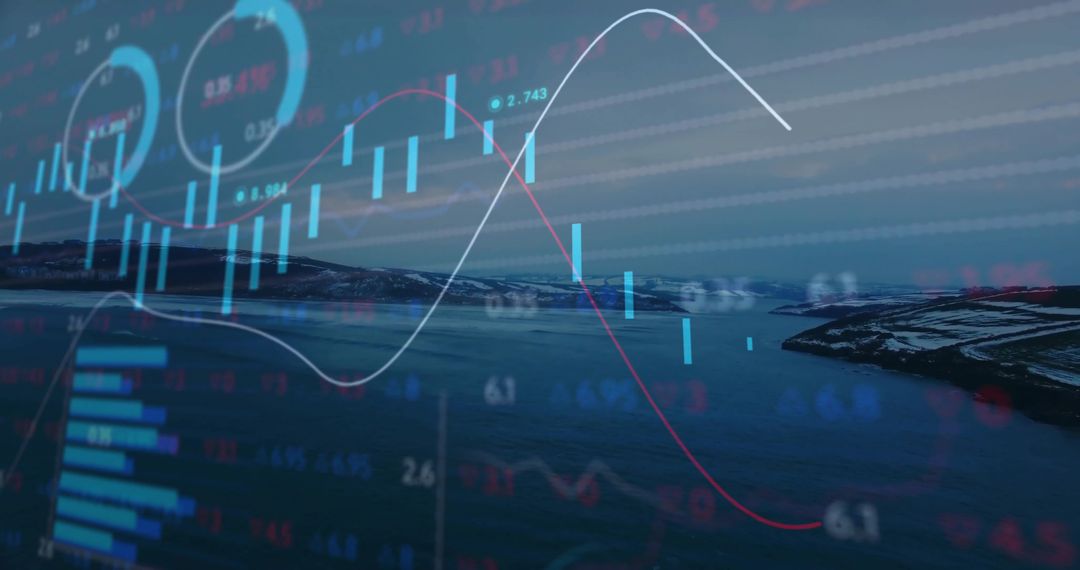
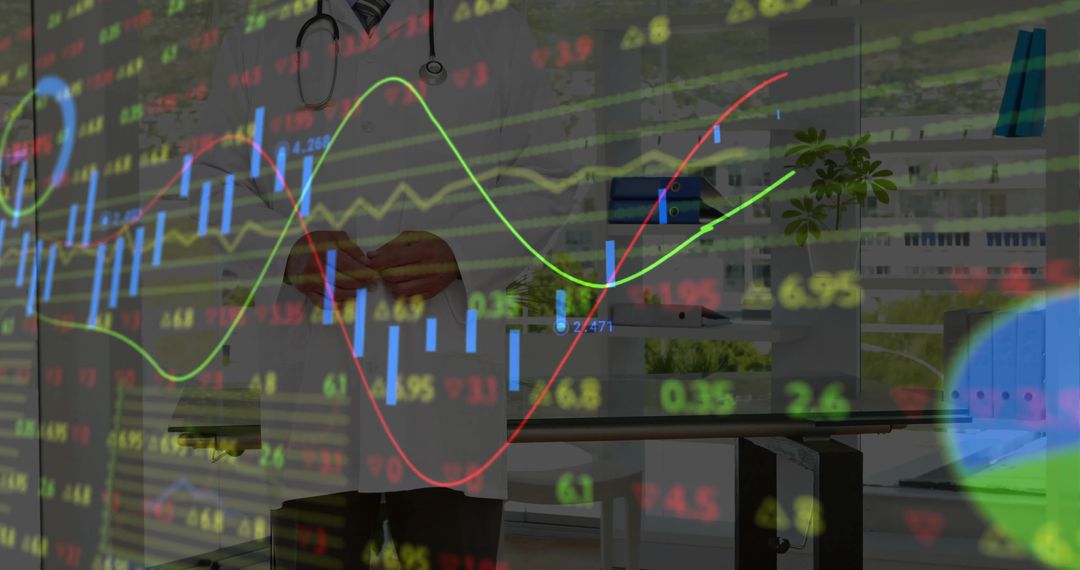
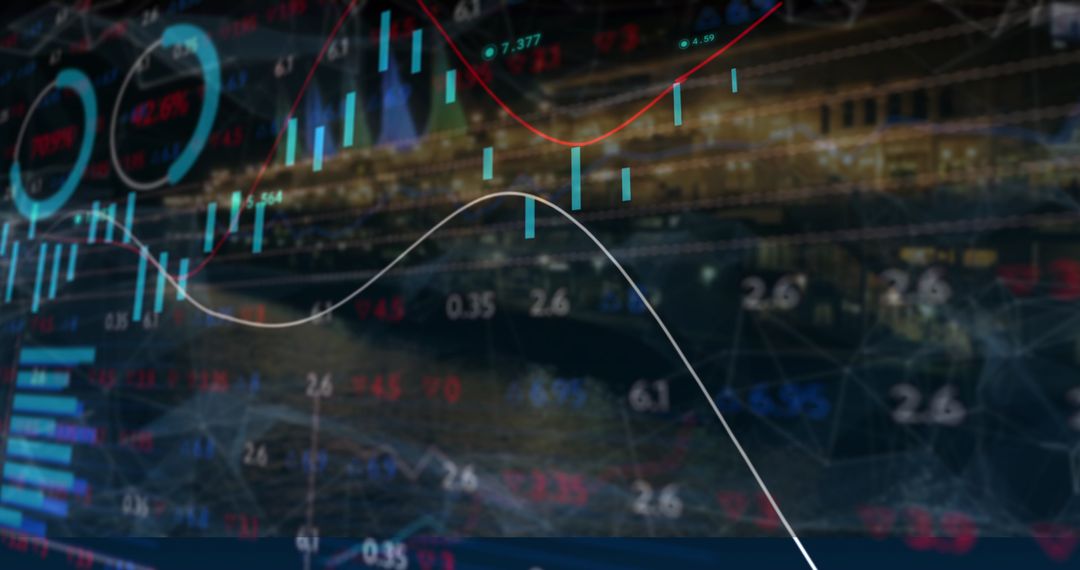
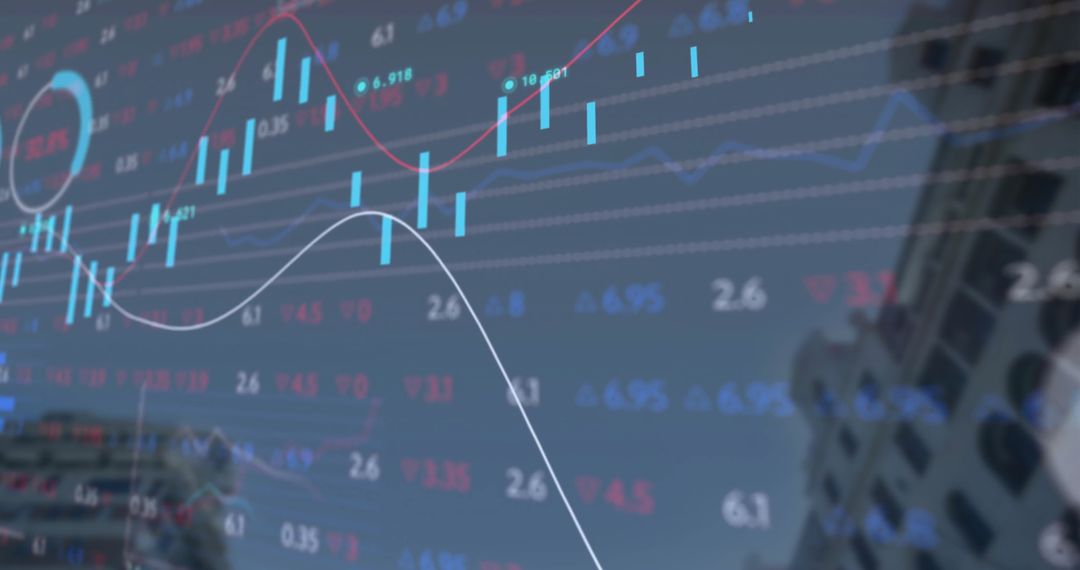
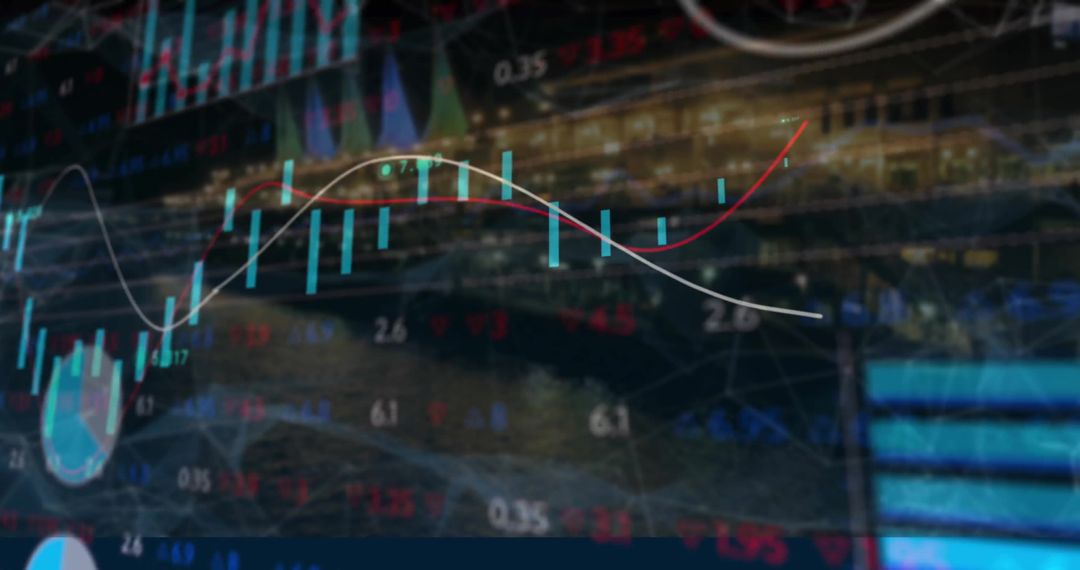
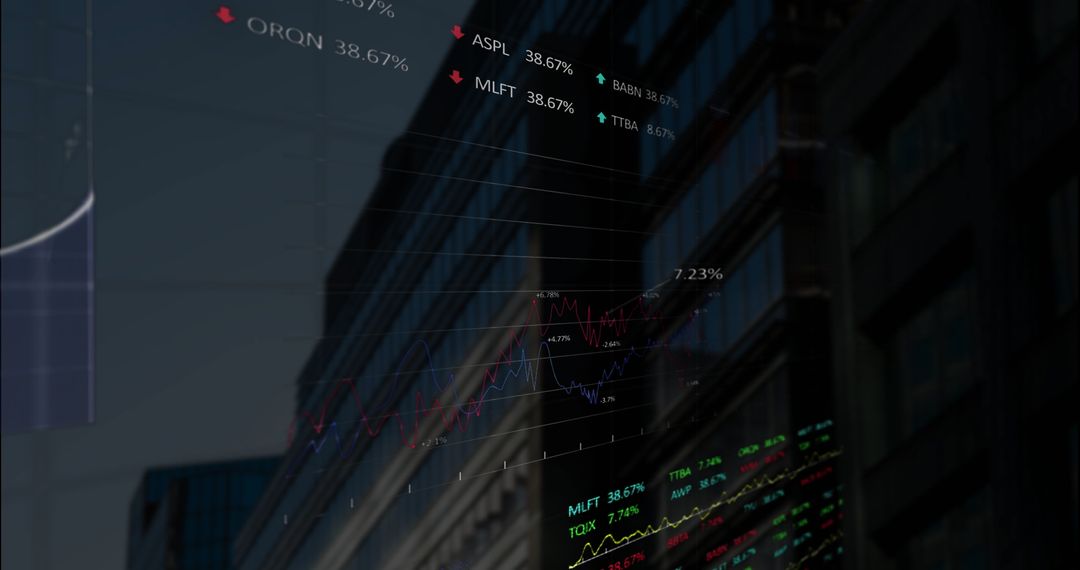
- City Fintech Overlay Showing Candlestick Charts, Trend Lines and Market Data Visuals
City Fintech Overlay Showing Candlestick Charts, Trend Lines and Market Data Visuals Image
Showing transparent candlestick charts, trend lines, tickers and numerical overlays blending with urban skyline to create dynamic fintech visual. Combining cityscape and data visualization for themes of trading, investment, market analytics and digital transformation. Working well for fintech websites, trading platform landing pages, investor reports, financial presentations, marketing campaigns and social media banners. Serving as backdrop for editorial content about market trends, economic forecasts, corporate finance and technology innovation. Using cool blue and red palette to convey market activity and volatility while providing versatile composition for wide hero banners, slide decks, report covers and advertising creatives.
Powered by  - Get 15% off with code: PIKWIZARD15


0
downloads
downloads
Tags:
More
Credit Photo
If you would like to credit the Photo, here are some ways you can do so
Text Link
photo Link
<span class="text-link">
<span>
<a target="_blank" href=https://pikwizard.com/photo/city-fintech-overlay-showing-candlestick-charts-trend-lines-and-market-data-visuals/5bdd8558dcf38bdb39eb9eb3bc25b4a4/>PikWizard</a>
</span>
</span>
<span class="image-link">
<span
style="margin: 0 0 20px 0; display: inline-block; vertical-align: middle; width: 100%;"
>
<a
target="_blank"
href="https://pikwizard.com/photo/city-fintech-overlay-showing-candlestick-charts-trend-lines-and-market-data-visuals/5bdd8558dcf38bdb39eb9eb3bc25b4a4/"
style="text-decoration: none; font-size: 10px; margin: 0;"
>
<img src="https://pikwizard.com/pw/medium/5bdd8558dcf38bdb39eb9eb3bc25b4a4.jpg" style="margin: 0; width: 100%;" alt="" />
<p style="font-size: 12px; margin: 0;">PikWizard</p>
</a>
</span>
</span>
Free (free of charge)
Free for personal and commercial use.
Author: Authentic Images
Similar Free Stock Images

Premium


Premium


Premium


Premium


Premium


Premium


Premium


Premium


Premium


Premium


Premium


Premium


Premium


Premium


Premium


Premium


Premium


Premium


Premium


Premium


Premium


Premium


Premium


Premium