- Home >
- Stock Photos >
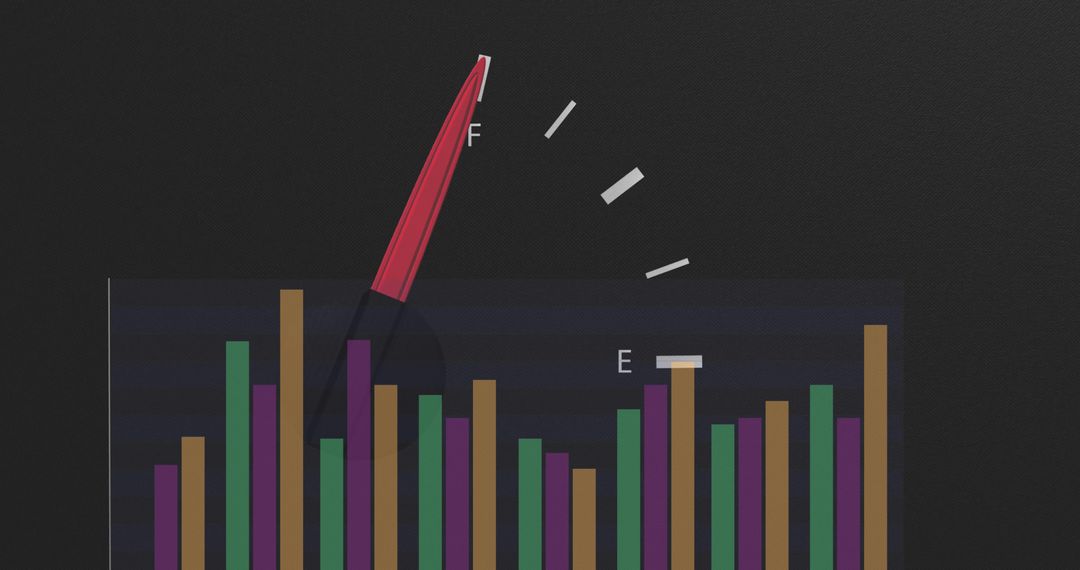
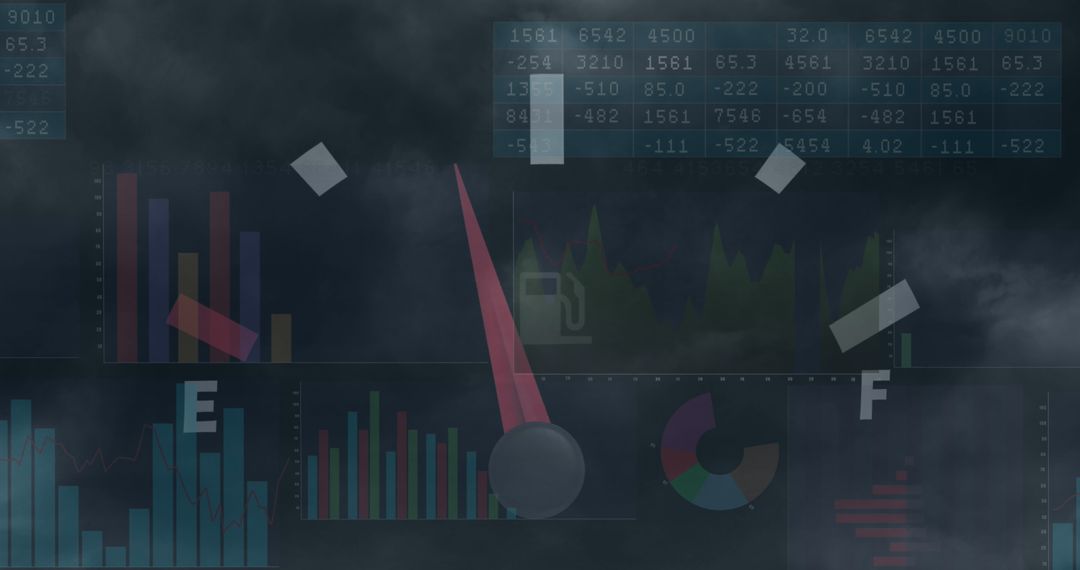
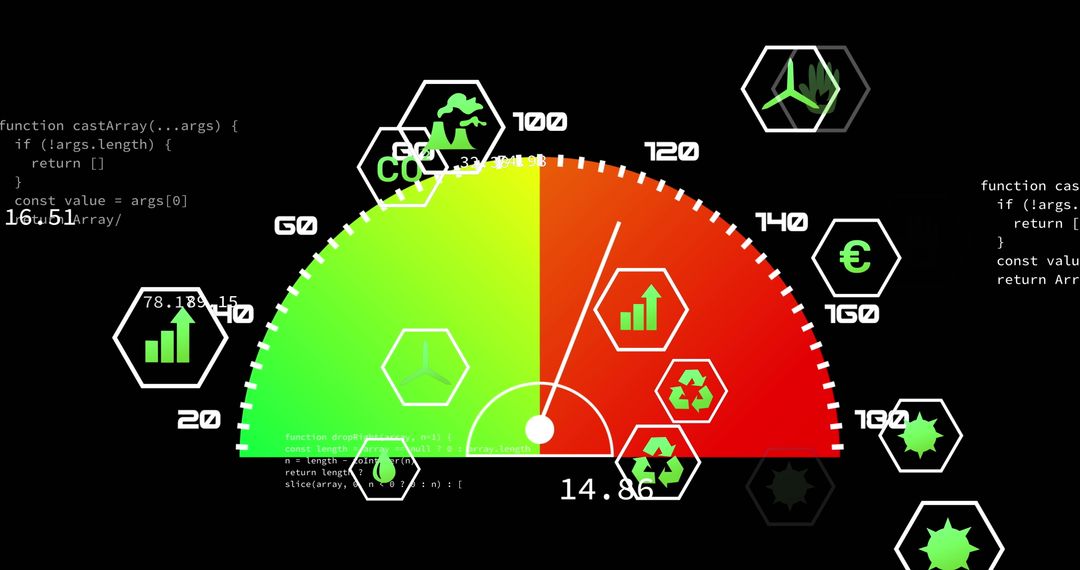
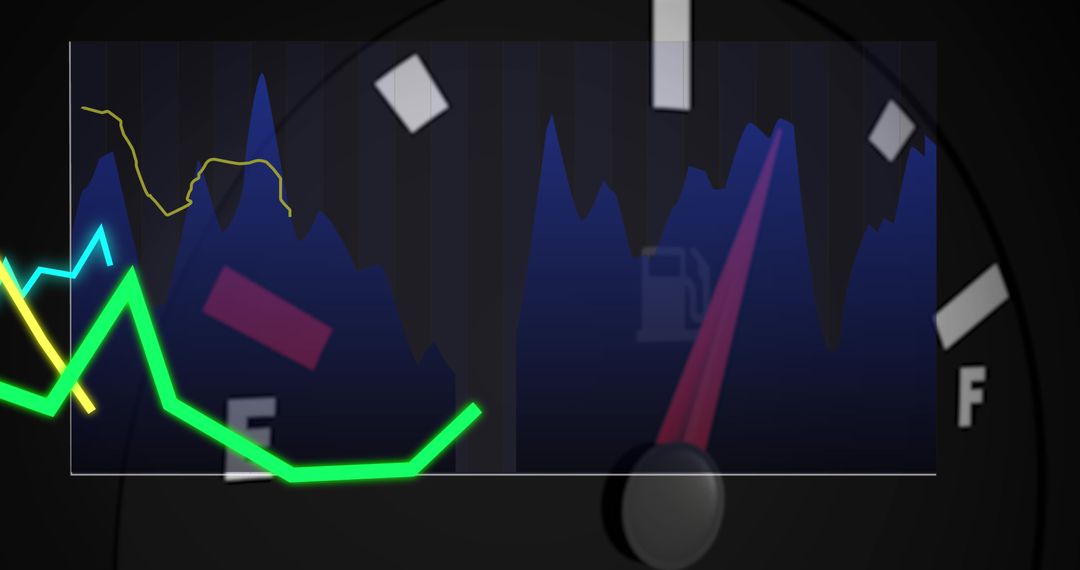
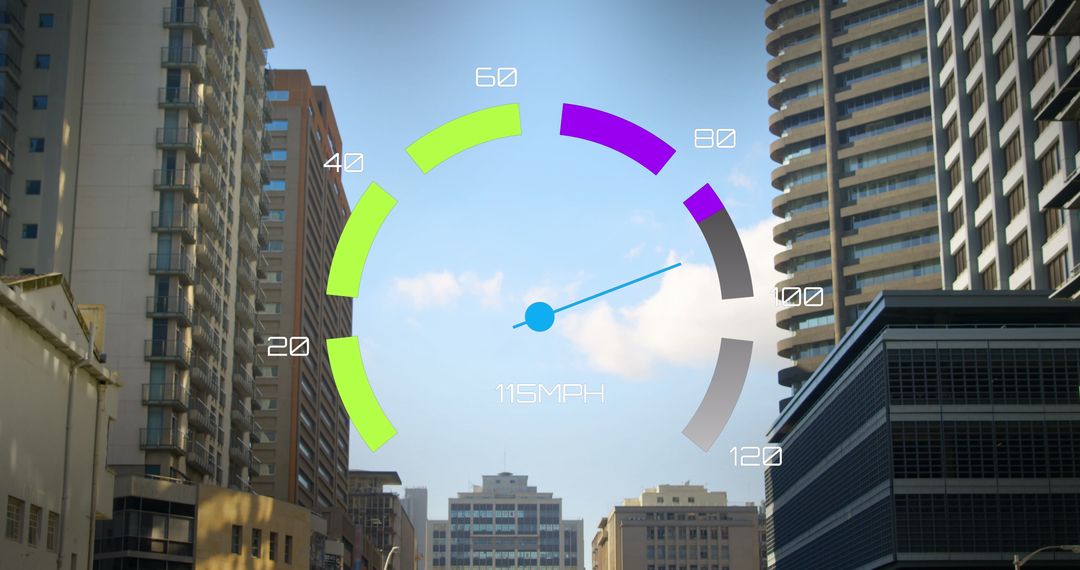
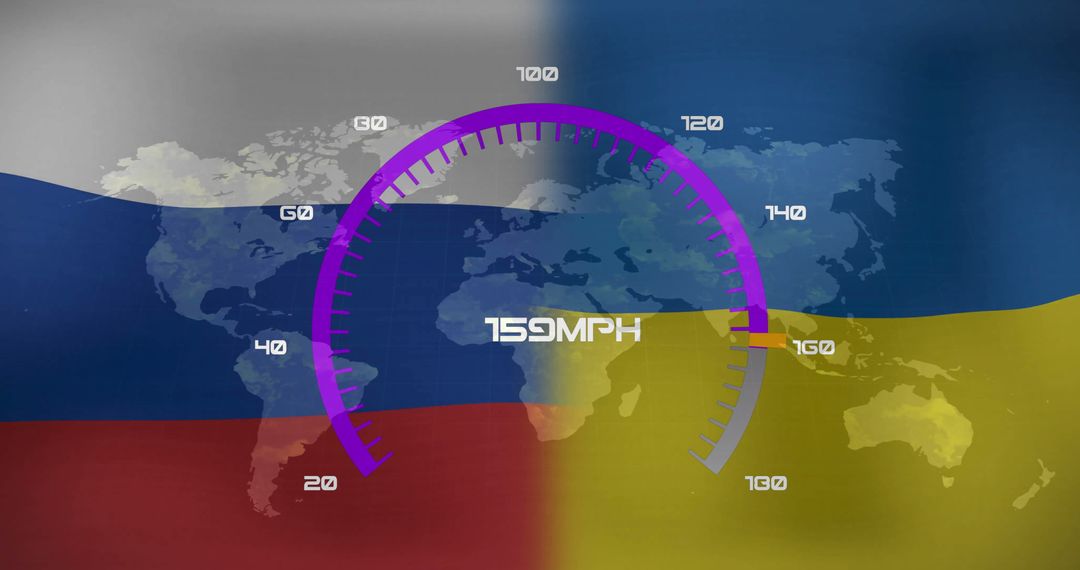
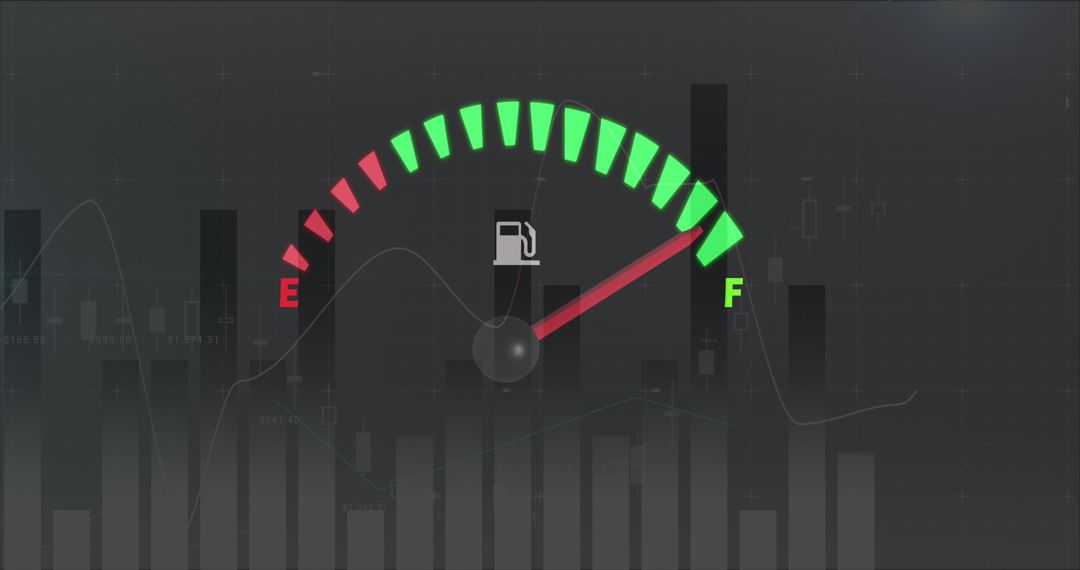
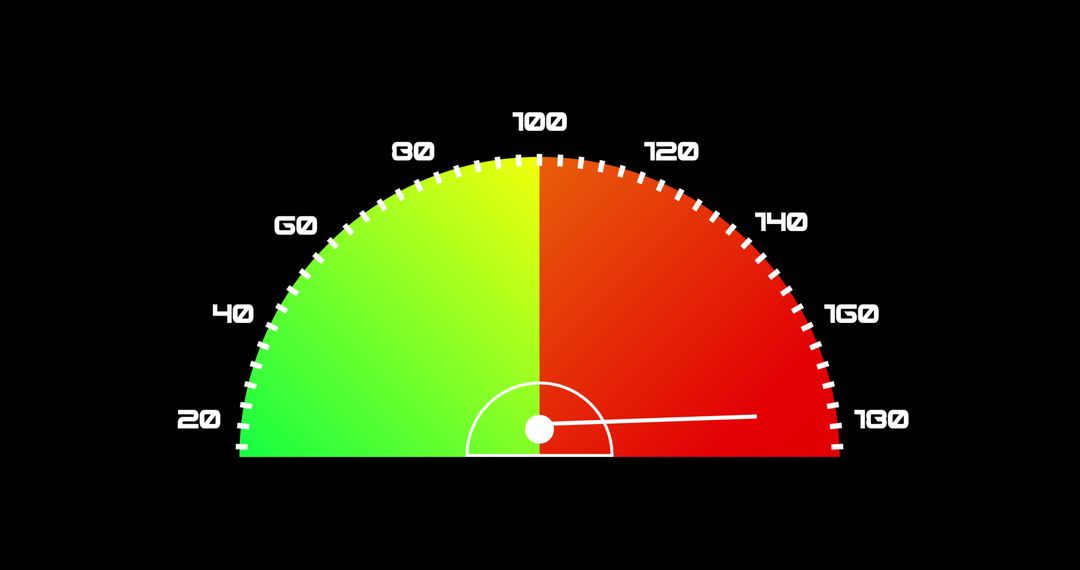
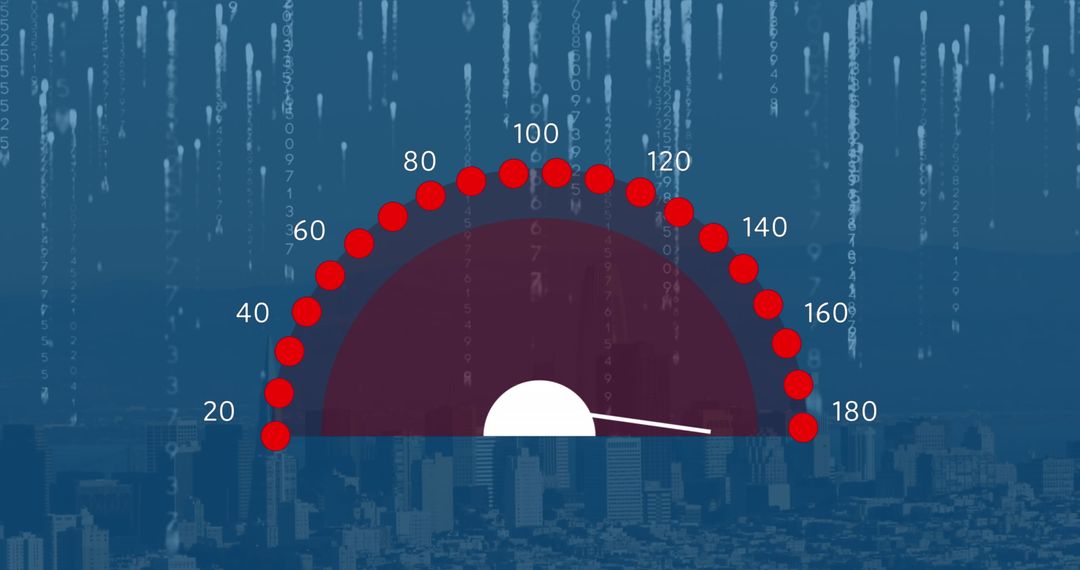
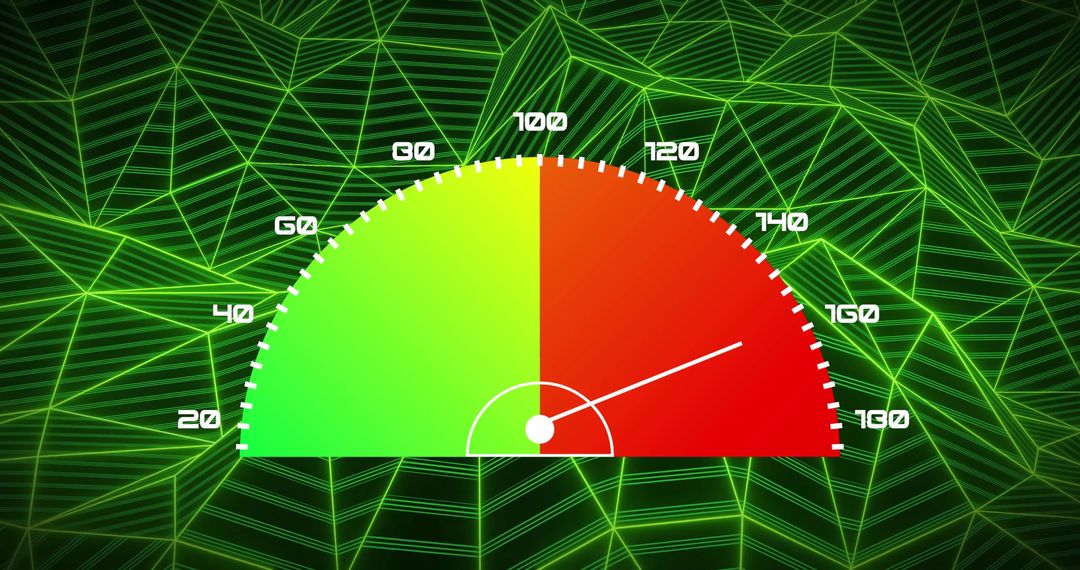
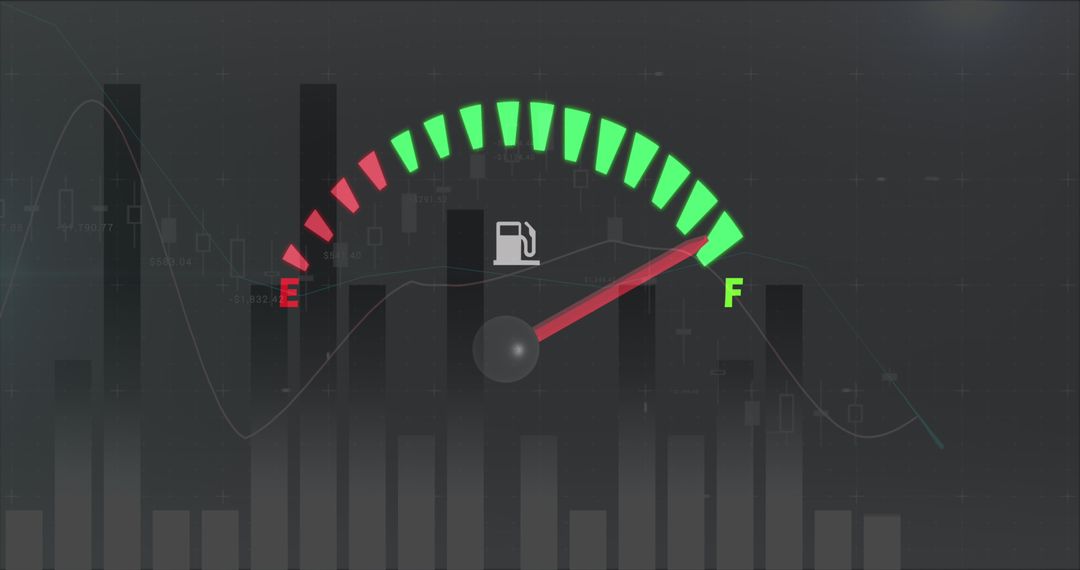
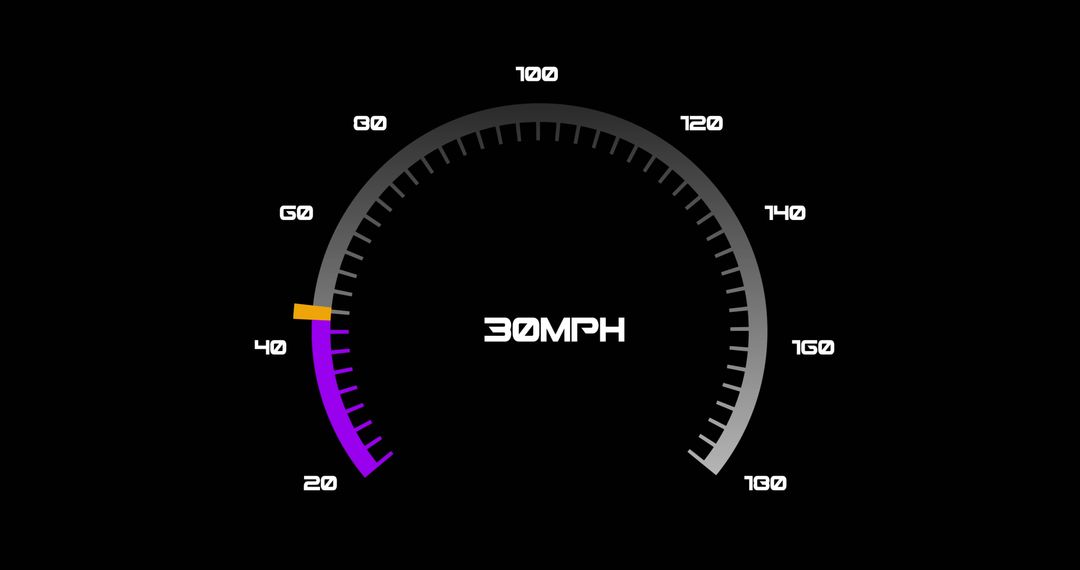
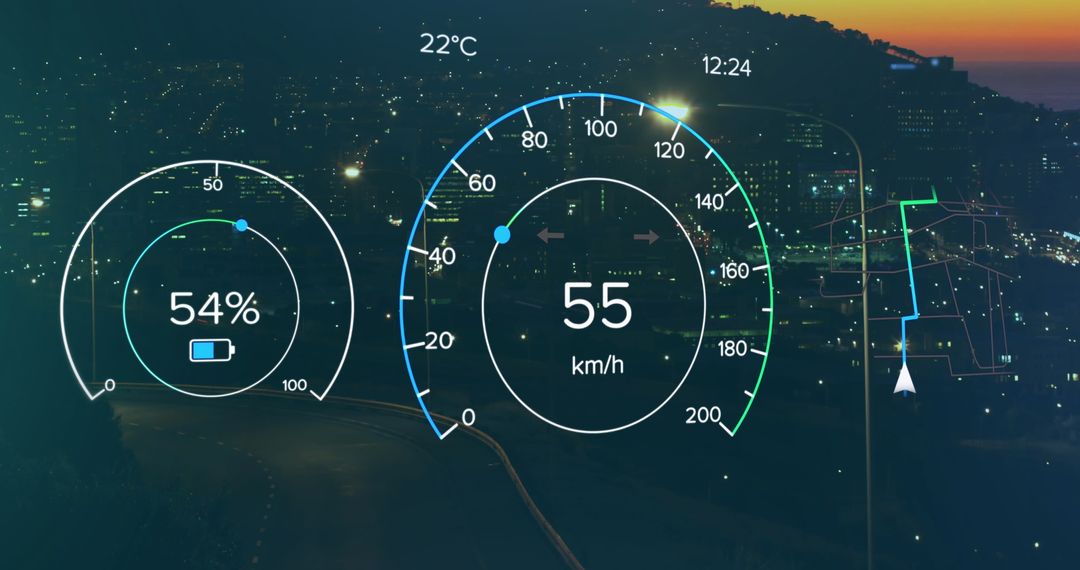
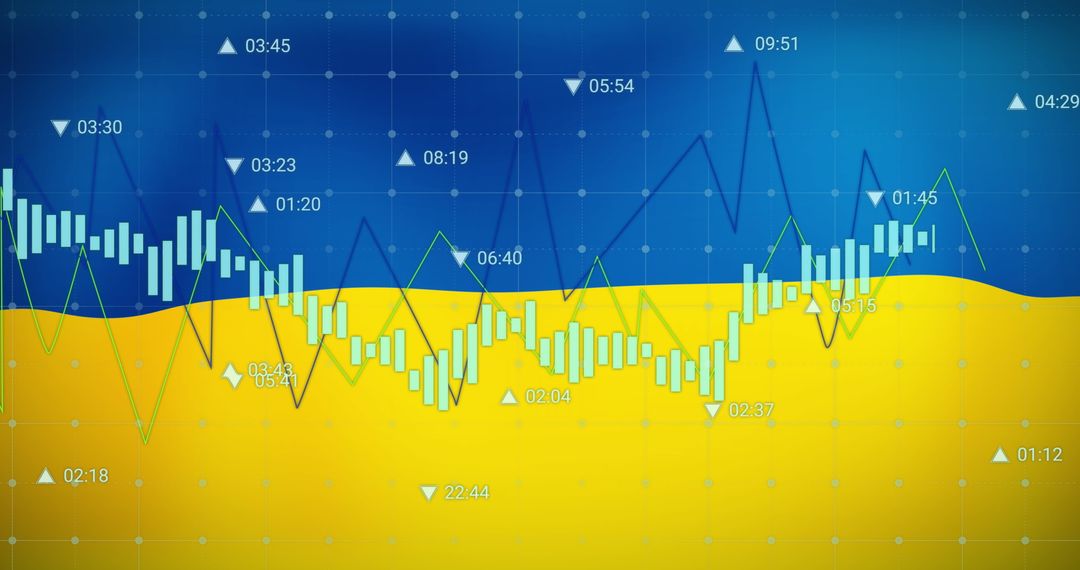
- Color-Coded Gauge Chart on Urban Skyline Background
Color-Coded Gauge Chart on Urban Skyline Background Image
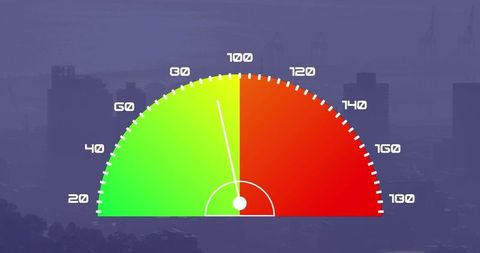
This image depicts a semicircular color-coded gauge against an urban skyline. Ideal for use in presentations or websites focused on performance analytics, data visualization, or technological applications. The color gradient and needle detail effectively communicate measurement and evaluation concepts, which could aid in illustrating points during discussions on efficiency, progress, or analytics insights.
Powered by  - Get 15% off with code: PIKWIZARD15


2
downloads
downloads
Tags:
More
Credit Photo
If you would like to credit the Photo, here are some ways you can do so
Text Link
photo Link
<span class="text-link">
<span>
<a target="_blank" href=https://pikwizard.com/photo/color-coded-gauge-chart-on-urban-skyline-background/12867adf3e52d12a8359dd49207907d1/>PikWizard</a>
</span>
</span>
<span class="image-link">
<span
style="margin: 0 0 20px 0; display: inline-block; vertical-align: middle; width: 100%;"
>
<a
target="_blank"
href="https://pikwizard.com/photo/color-coded-gauge-chart-on-urban-skyline-background/12867adf3e52d12a8359dd49207907d1/"
style="text-decoration: none; font-size: 10px; margin: 0;"
>
<img src="https://pikwizard.com/pw/medium/12867adf3e52d12a8359dd49207907d1.jpg" style="margin: 0; width: 100%;" alt="" />
<p style="font-size: 12px; margin: 0;">PikWizard</p>
</a>
</span>
</span>
Free (free of charge)
Free for personal and commercial use.
Author: Authentic Images
Similar Free Stock Images

Premium


Premium


Premium


Premium

Premium


Premium


Premium


Premium


Premium


Premium


Premium


Premium


Premium


Premium

Premium


Premium


Premium


Premium


Premium


Premium


Premium


Premium


Premium


Premium