- Home >
- Stock Photos >
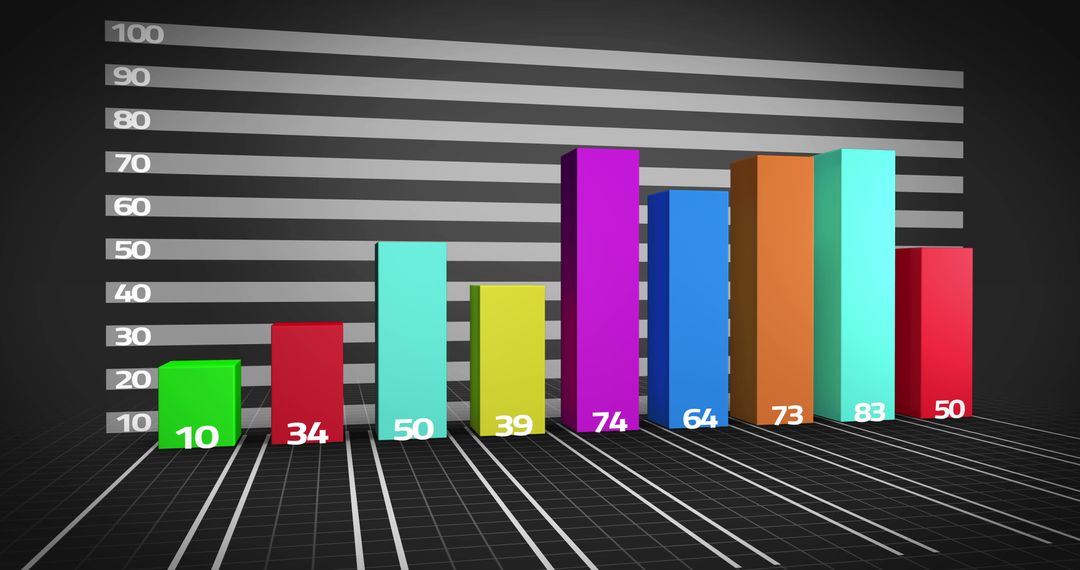
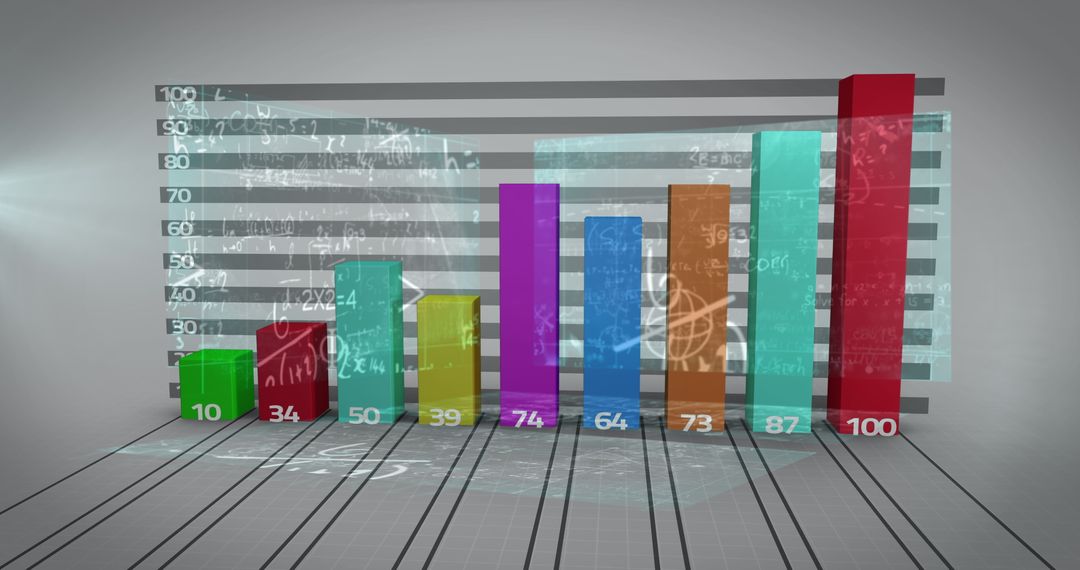
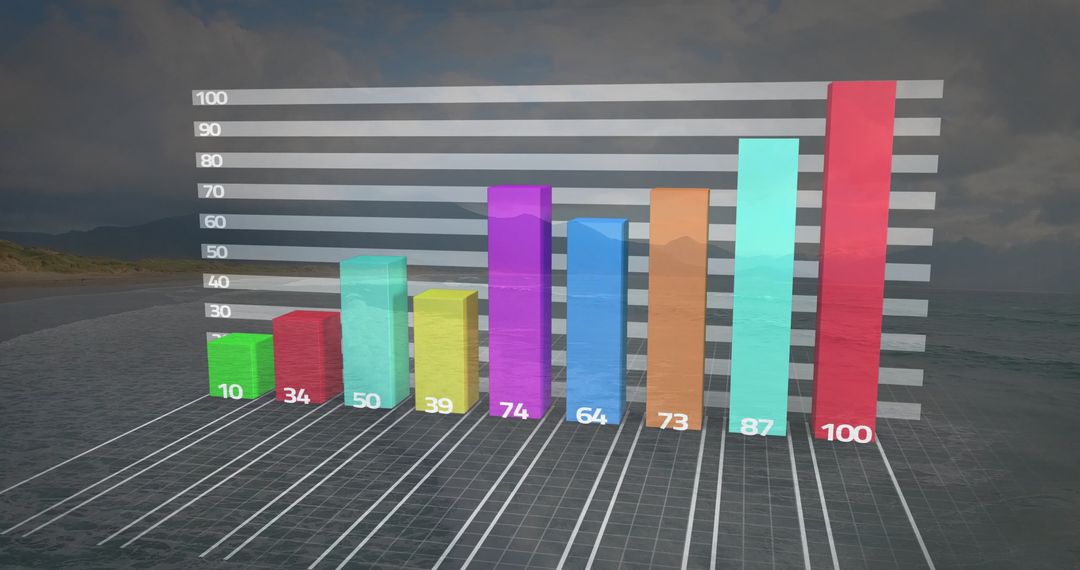
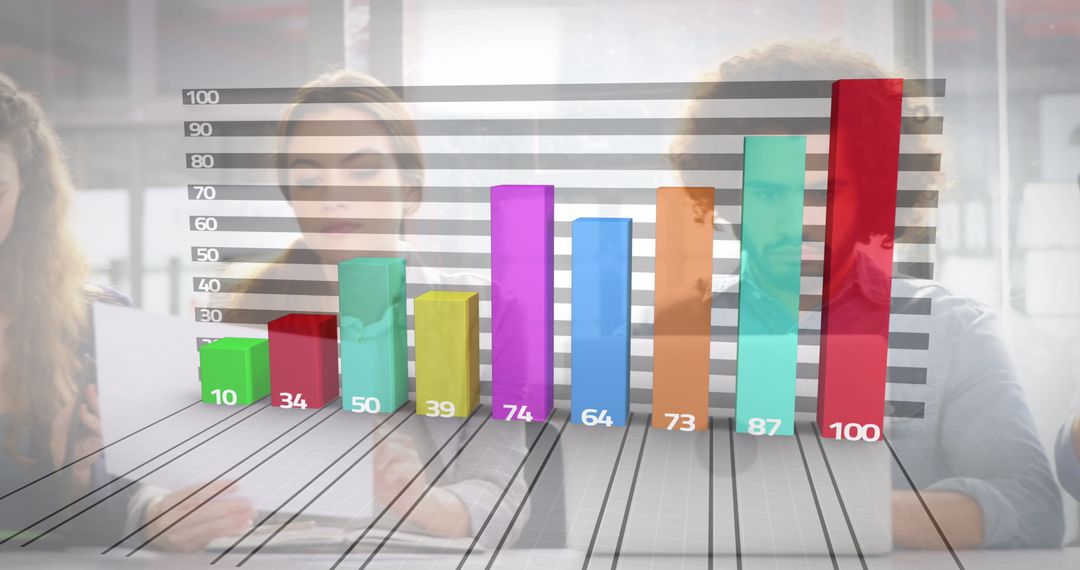
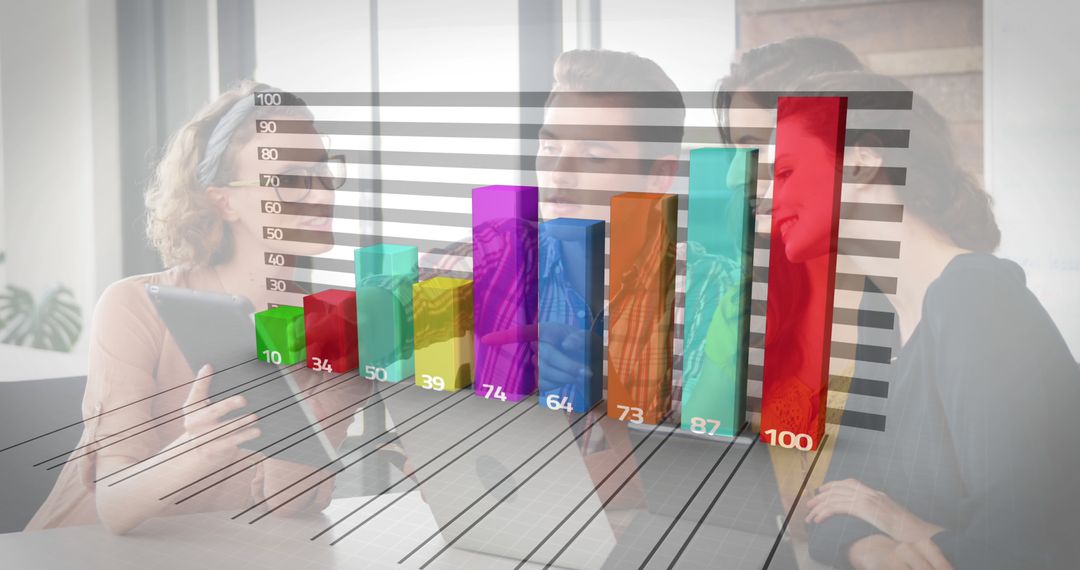
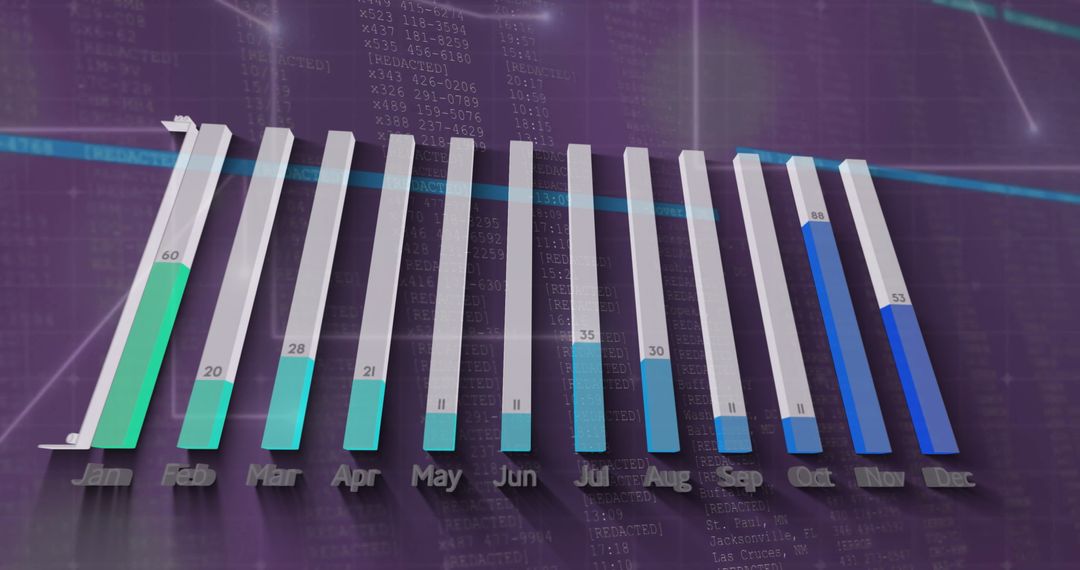
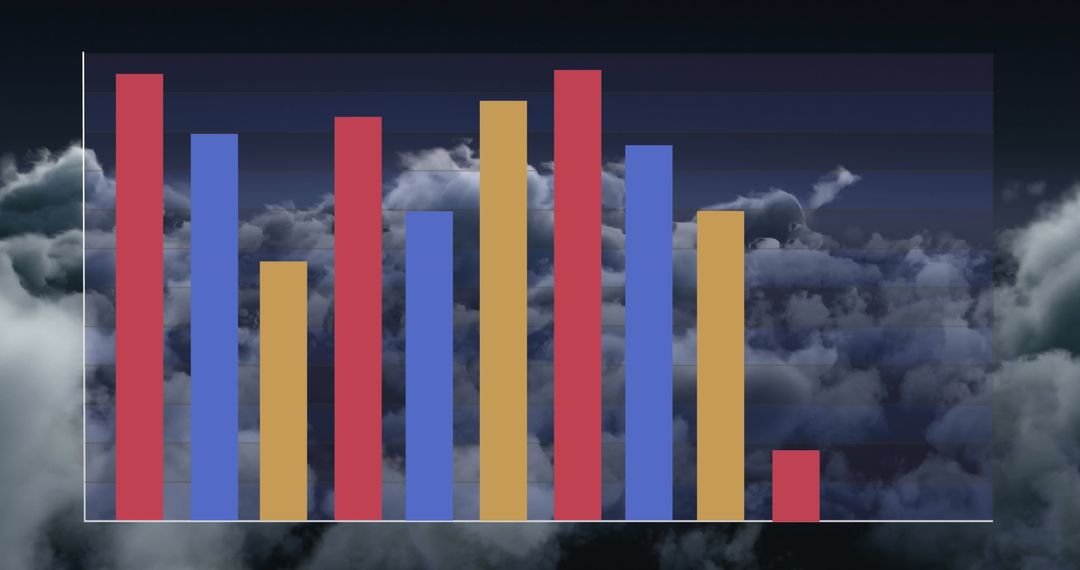
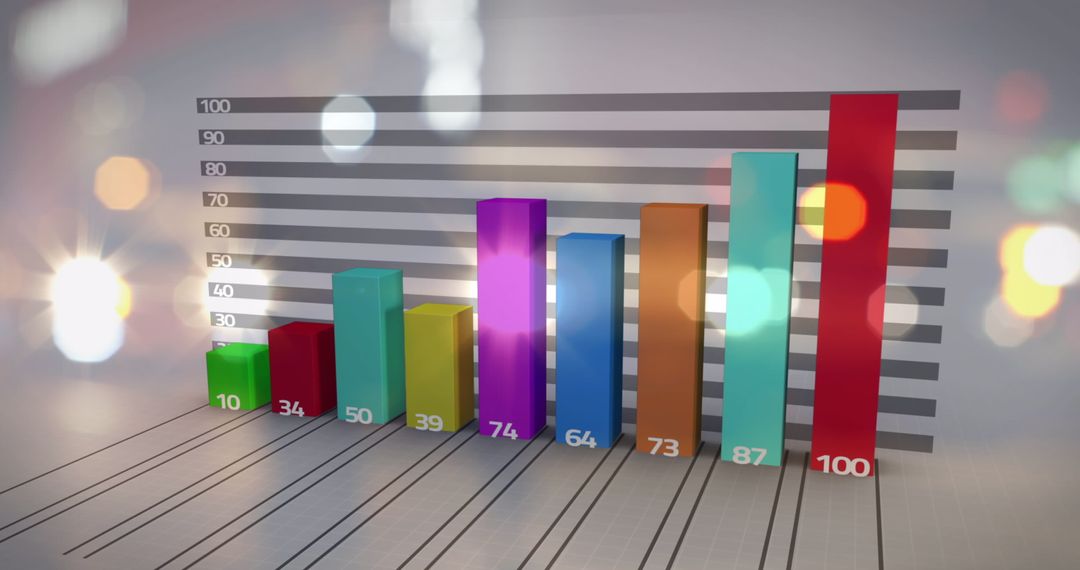
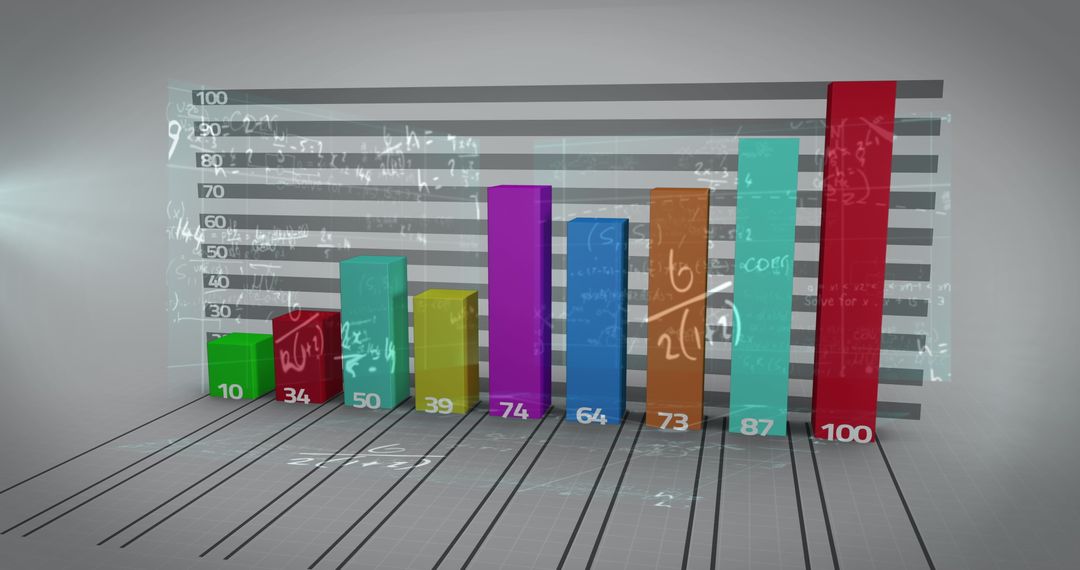
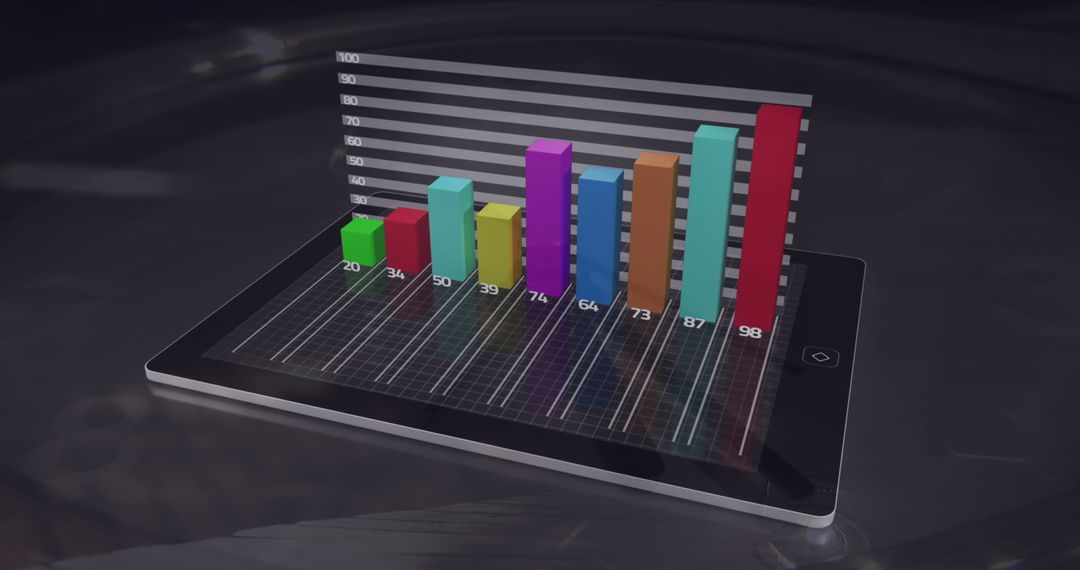
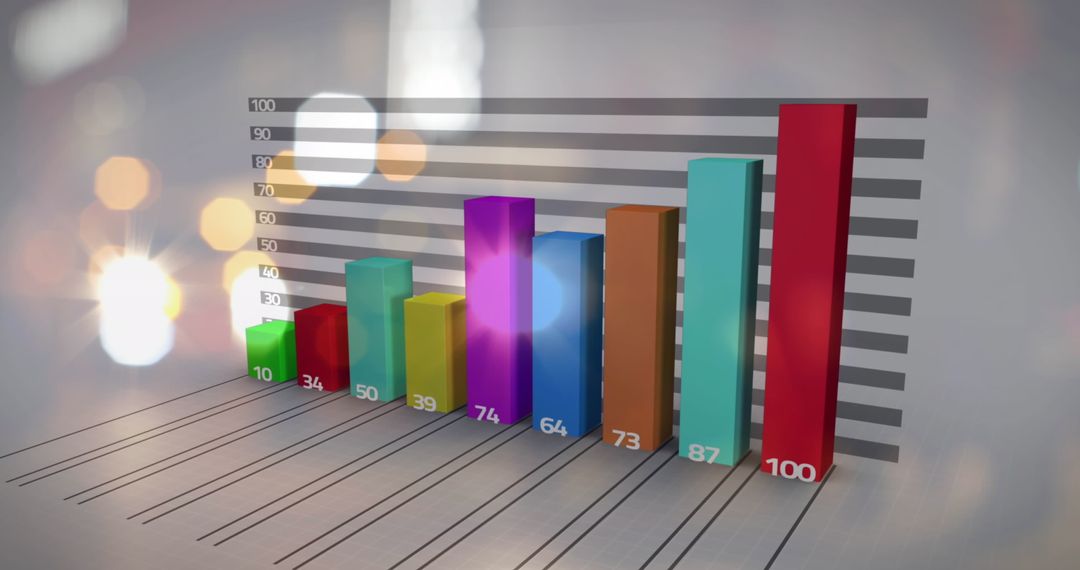
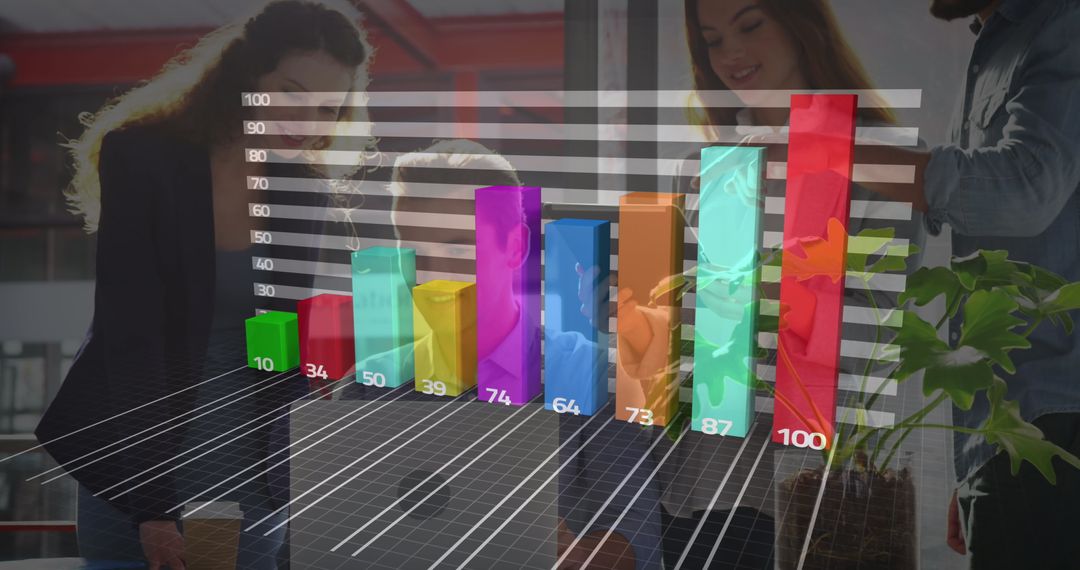
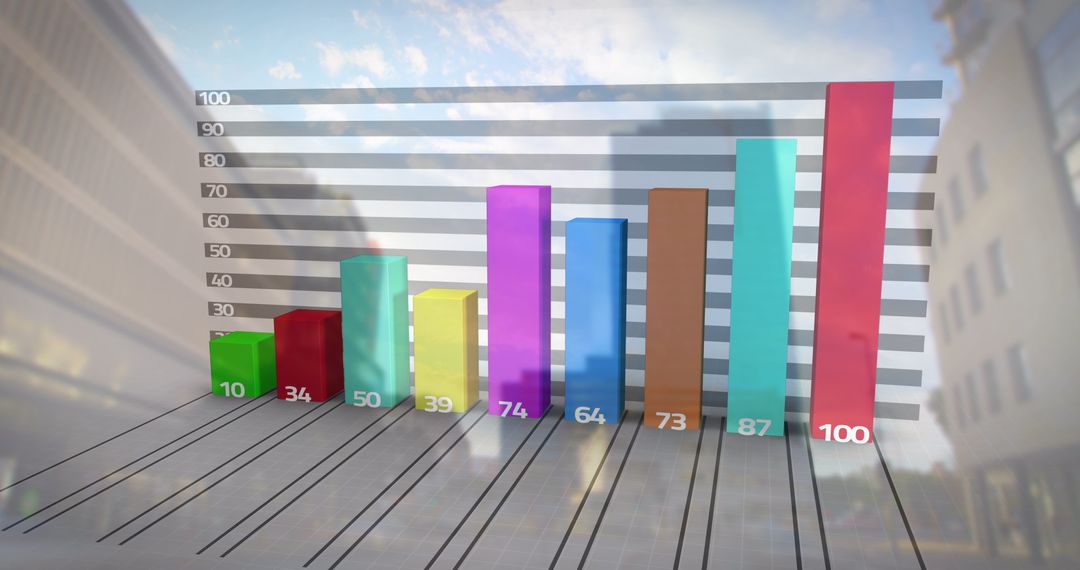
- Colorful 3D Bar Graph Over Urban Scene for Business Analysis
Colorful 3D Bar Graph Over Urban Scene for Business Analysis Image
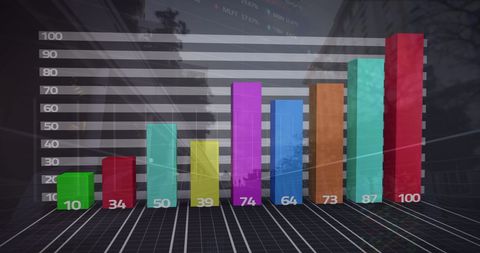
A vibrant 3D bar graph overlaid on a bustling urban background represents complex business data visualization. Use this for illustrating business growth, data analytics presentations, financial reports, and technology-driven urban themes.
Powered by 


2
downloads
downloads
Tags:
More
Credit Photo
If you would like to credit the Photo, here are some ways you can do so
Text Link
photo Link
<span class="text-link">
<span>
<a target="_blank" href=https://pikwizard.com/photo/colorful-3d-bar-graph-over-urban-scene-for-business-analysis/9555601e788dbf5450e36ac82b6f29b8/>PikWizard</a>
</span>
</span>
<span class="image-link">
<span
style="margin: 0 0 20px 0; display: inline-block; vertical-align: middle; width: 100%;"
>
<a
target="_blank"
href="https://pikwizard.com/photo/colorful-3d-bar-graph-over-urban-scene-for-business-analysis/9555601e788dbf5450e36ac82b6f29b8/"
style="text-decoration: none; font-size: 10px; margin: 0;"
>
<img src="https://pikwizard.com/pw/medium/9555601e788dbf5450e36ac82b6f29b8.jpg" style="margin: 0; width: 100%;" alt="" />
<p style="font-size: 12px; margin: 0;">PikWizard</p>
</a>
</span>
</span>
Free (free of charge)
Free for personal and commercial use.
Author: Creative Art
Similar Free Stock Images

Premium


Premium


Premium


Premium


Premium


Premium


Premium


Premium


Premium


Premium


Premium


Premium


Premium


Premium


Premium


Premium


Premium


Premium


Premium


Premium


Premium


Premium


Premium


Premium