- Home >
- Stock Photos >
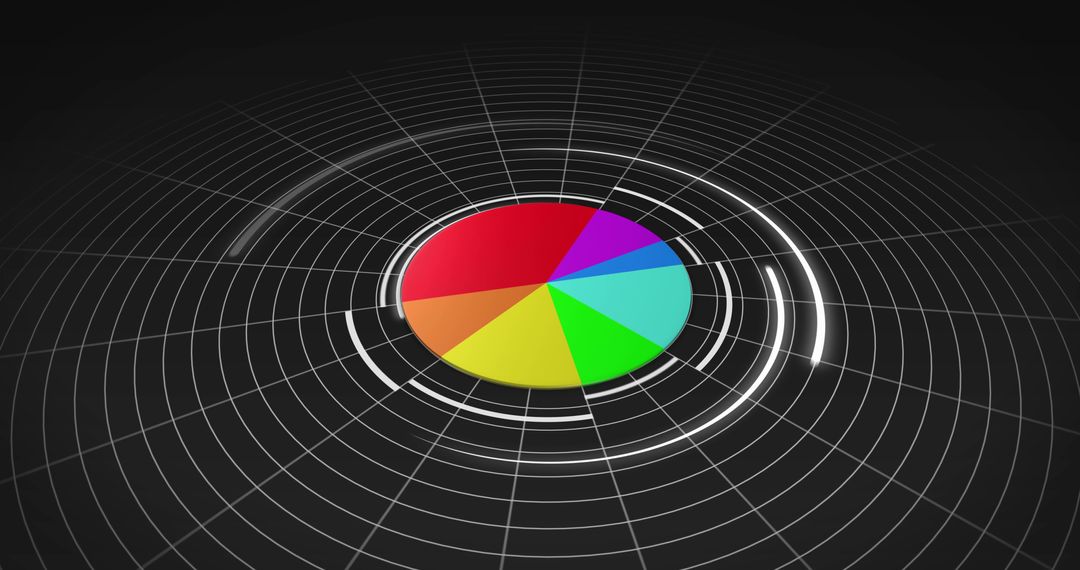
- Colorful 3D Pie Chart with Scanning Grid Effect
Colorful 3D Pie Chart with Scanning Grid Effect Image

This 3D pie chart is vividly displayed with multiple colors over a grid, combining elements of data processing with futuristic design. It is perfect for presentations, reports, and educational materials where representing complex data in a visually engaging manner is needed. Additionally, it can be used in business analytics, economic forecasting, or global computing concepts to visually express statistical results.
Powered by  - Get 15% off with code: PIKWIZARD15


2
downloads
downloads
Tags:
More
Credit Photo
If you would like to credit the Photo, here are some ways you can do so
Text Link
photo Link
<span class="text-link">
<span>
<a target="_blank" href=https://pikwizard.com/photo/colorful-3d-pie-chart-with-scanning-grid-effect/526271b7356fb352d117c8893c361dad/>PikWizard</a>
</span>
</span>
<span class="image-link">
<span
style="margin: 0 0 20px 0; display: inline-block; vertical-align: middle; width: 100%;"
>
<a
target="_blank"
href="https://pikwizard.com/photo/colorful-3d-pie-chart-with-scanning-grid-effect/526271b7356fb352d117c8893c361dad/"
style="text-decoration: none; font-size: 10px; margin: 0;"
>
<img src="https://pikwizard.com/pw/medium/526271b7356fb352d117c8893c361dad.jpg" style="margin: 0; width: 100%;" alt="" />
<p style="font-size: 12px; margin: 0;">PikWizard</p>
</a>
</span>
</span>
Free (free of charge)
Free for personal and commercial use.
Author: People Creations
Similar Free Stock Images