- Home >
- Stock Photos >
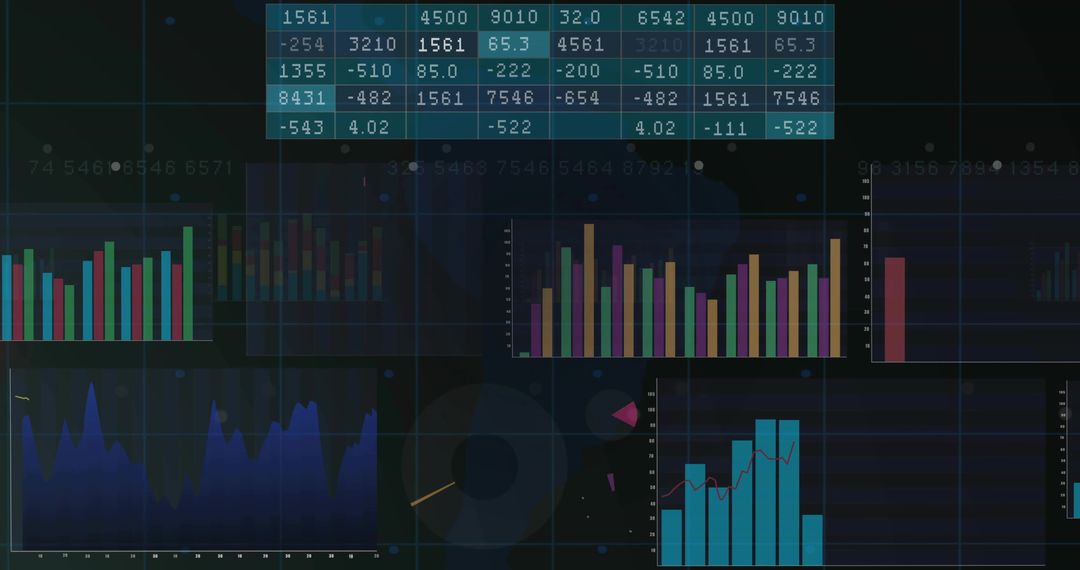
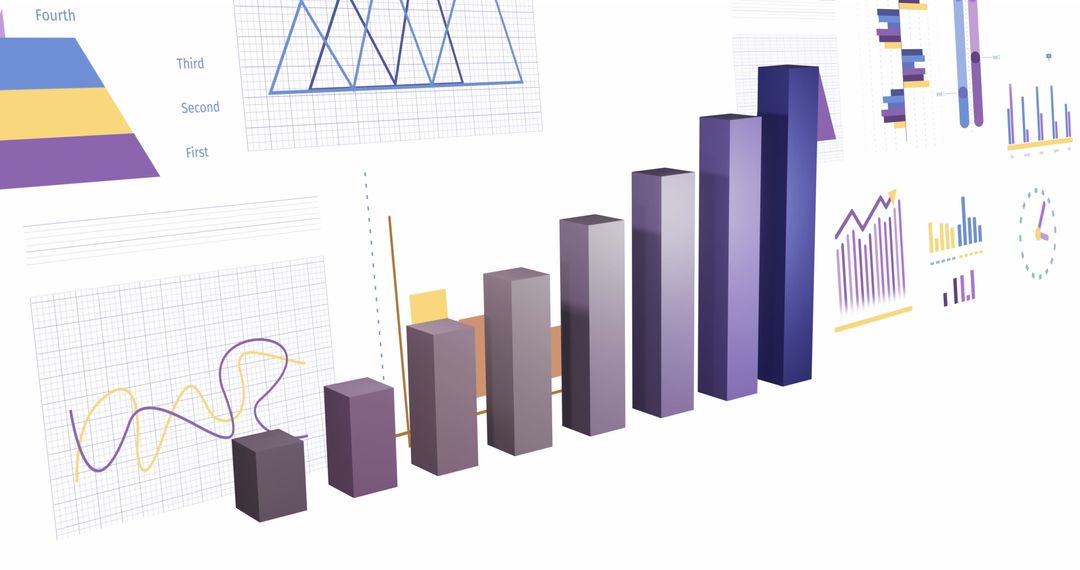
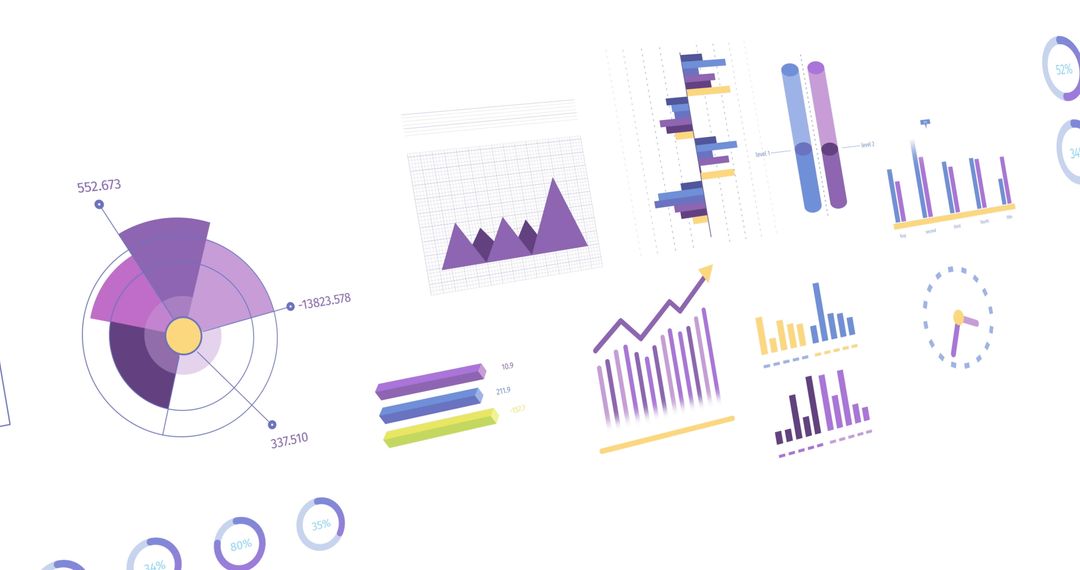
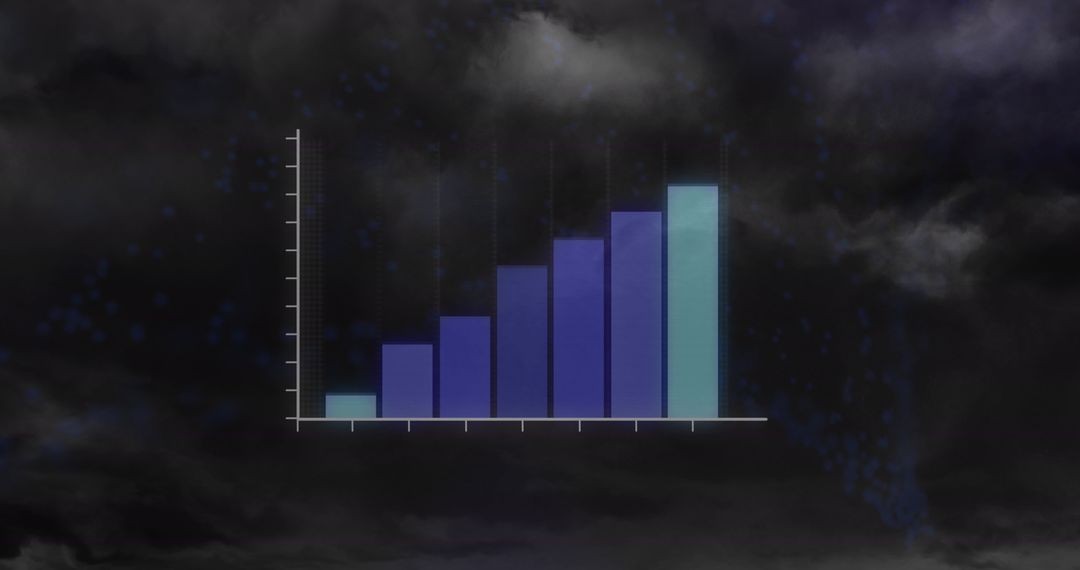
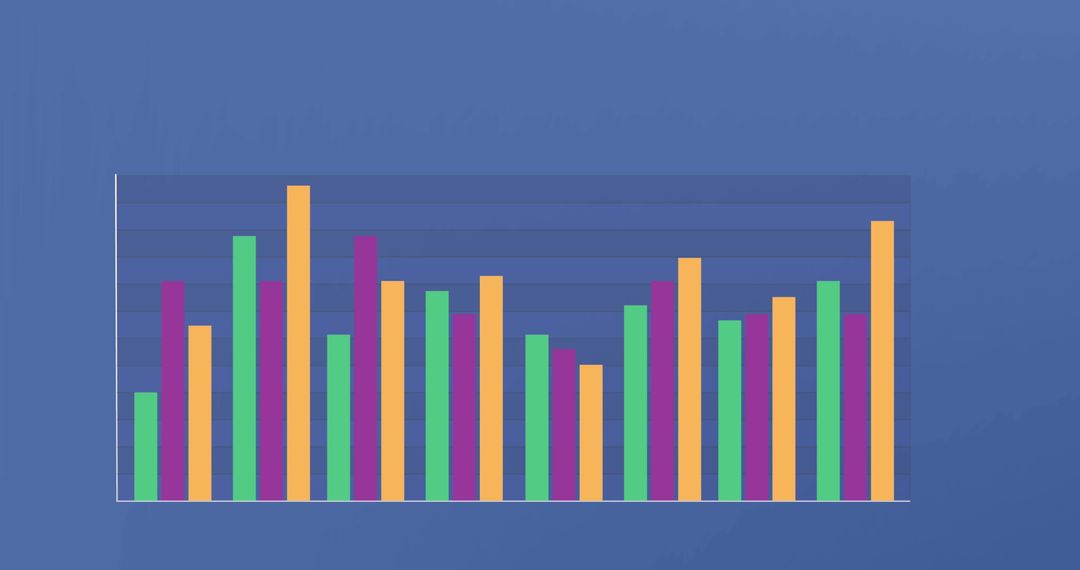
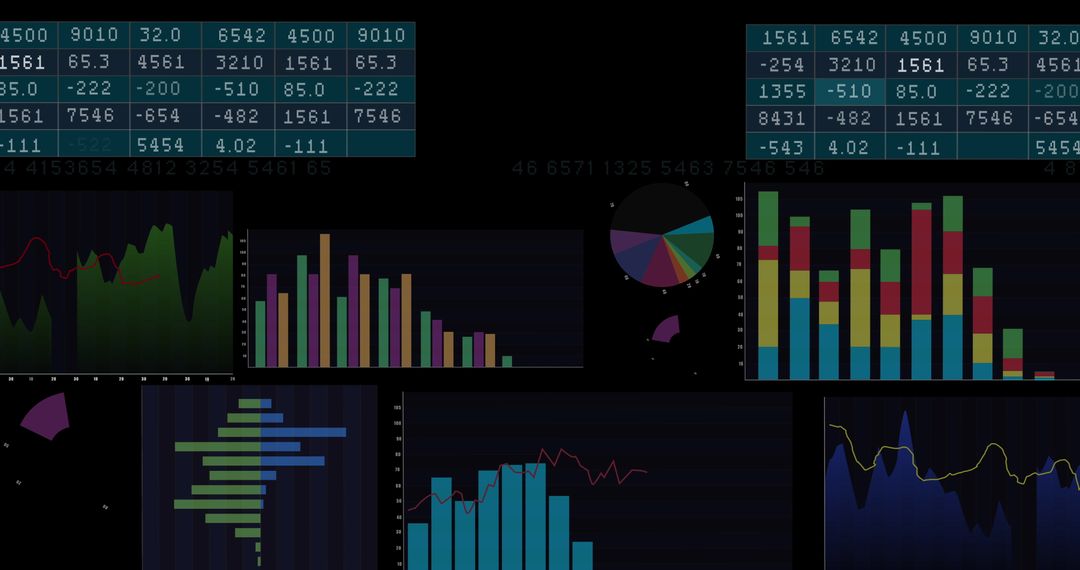
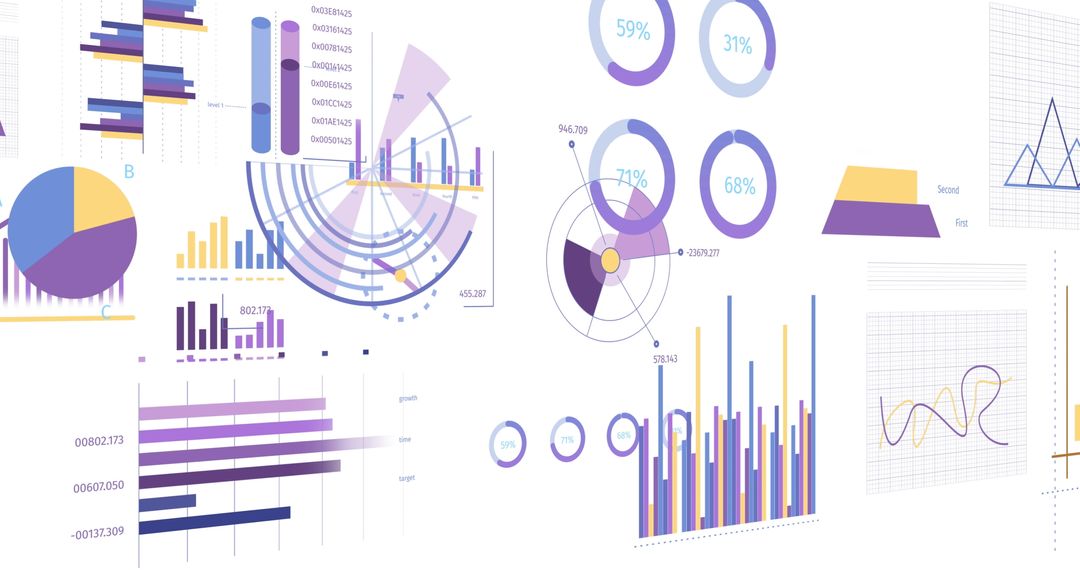
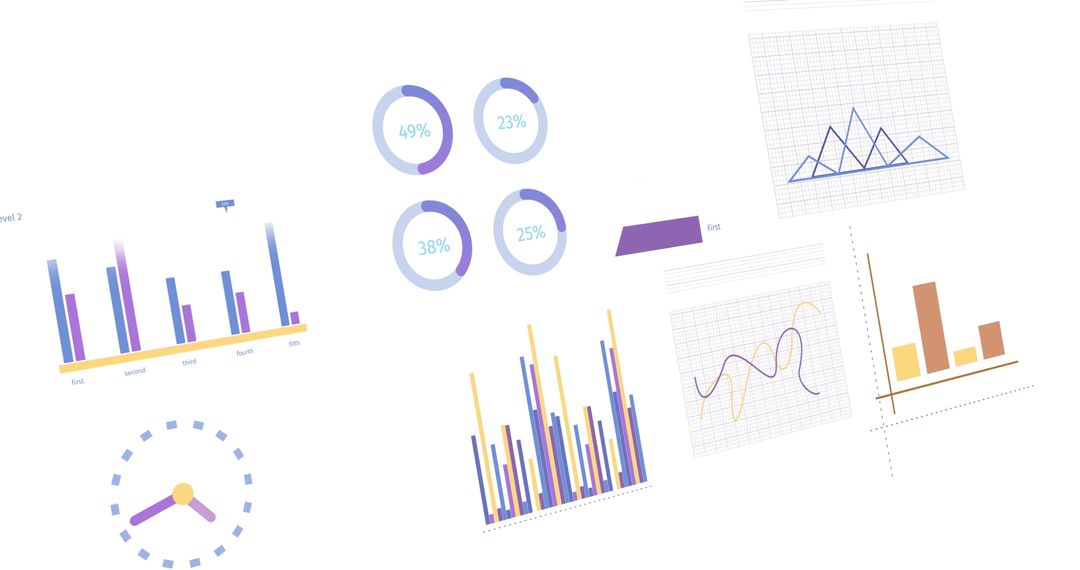
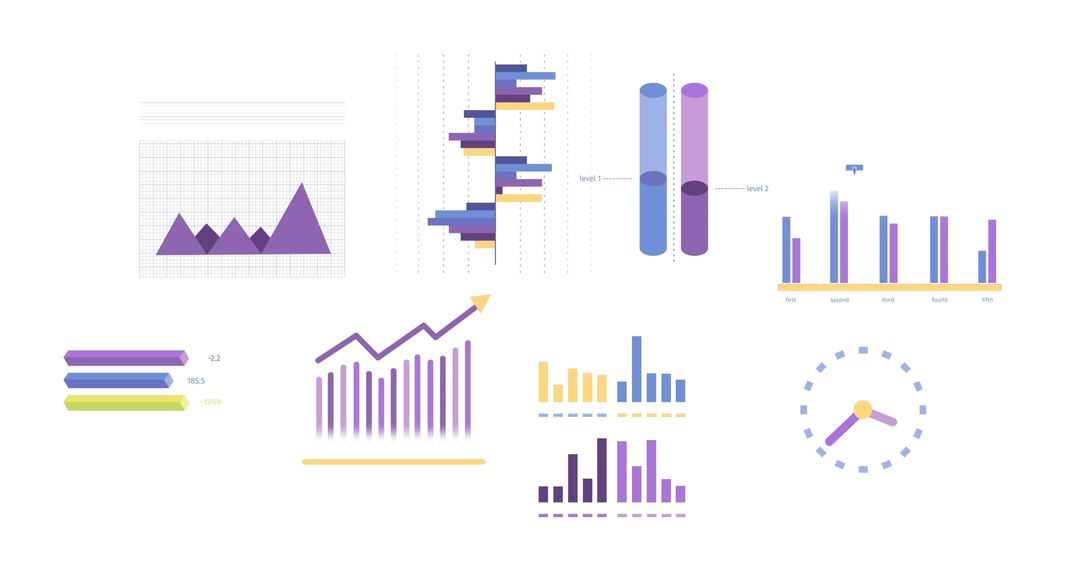
- Colorful Abstract Graphs and Charts for Data Analysis and Presentation
Colorful Abstract Graphs and Charts for Data Analysis and Presentation Image

Vibrant colorful graph and chart designs showcase various types of statistical data interpretation, ideal for presentations, reports, and data visualization projects. Useful for illustrating financial performance, market trends, business growth, or analytical research in educational and corporate environments.
Powered by 


2
downloads
downloads
Tags:
More
Credit Photo
If you would like to credit the Photo, here are some ways you can do so
Text Link
photo Link
<span class="text-link">
<span>
<a target="_blank" href=https://pikwizard.com/photo/colorful-abstract-graphs-and-charts-for-data-analysis-and-presentation/447defcb48277a75a040ba3ea9338ee7/>PikWizard</a>
</span>
</span>
<span class="image-link">
<span
style="margin: 0 0 20px 0; display: inline-block; vertical-align: middle; width: 100%;"
>
<a
target="_blank"
href="https://pikwizard.com/photo/colorful-abstract-graphs-and-charts-for-data-analysis-and-presentation/447defcb48277a75a040ba3ea9338ee7/"
style="text-decoration: none; font-size: 10px; margin: 0;"
>
<img src="https://pikwizard.com/pw/medium/447defcb48277a75a040ba3ea9338ee7.jpg" style="margin: 0; width: 100%;" alt="" />
<p style="font-size: 12px; margin: 0;">PikWizard</p>
</a>
</span>
</span>
Free (free of charge)
Free for personal and commercial use.
Author: People Creations
Similar Free Stock Images

Premium


Premium


Premium


Premium


Premium


Premium


Premium


Premium


Premium


Premium


Premium


Premium


Premium


Premium


Premium


Premium


Premium


Premium


Premium


Premium


Premium


Premium


Premium


Premium