1. Home > 
  2. Stock Photos > 
  3. Colorful Analytical Dashboard with Neon Green Line Chart

Colorful Analytical Dashboard with Neon Green Line Chart Image

Colorful Analytical Dashboard with Neon Green Line Chart

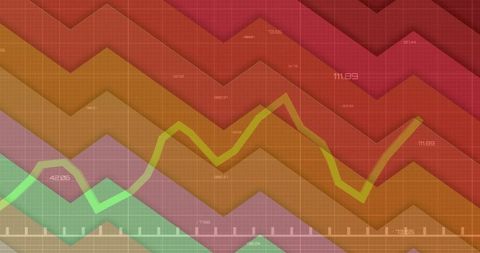
Abstract visualization of data dashboard featuring a prominent neon green zigzag line with overlapping colorful area curves. Perfect for illustrating business analysis, statistical trends, and technology sectors. Ideal for digital marketing agencies, data scientists, and educators specializing in data interpretation.

Powered by Shutterstock logo - Get 15% off with code: PIKWIZARD15
Displaying color chart on glass, tracking trends in dim office with labels and colleagues in shirts. Data, analytics, visualization, dashboard, meeting, collaboration, monitors - Powered by Shutterstock - Get 15% off with code: PIKWIZARD15Overlaying multi-colored bar charts across downtown skyline, with gridlines and numerical labels. Urban, data analytics, visualization, technology, finance, modernism, business - Powered by Shutterstock - Get 15% off with code: PIKWIZARD15Standing worker wearing light top checking laptop and left monitor at office, HUD overlays. Workstation, data, analytics, visualization, minimalist, openplan, coworking - Powered by Shutterstock - Get 15% off with code: PIKWIZARD15Gesturing woman in light sleeveless top viewing AR charts at desk by laptop curtained window shelf. Holographic, data, analytics, visualization, graphs, bright, minimalist - Powered by Shutterstock - Get 15% off with code: PIKWIZARD15Displaying candlestick charts over airport runway at night, with centerline lights and light trails. Technology, finance, data, analytics, visualization, night, modern - Powered by Shutterstock - Get 15% off with code: PIKWIZARD15

Credit Photo

If you would like to credit the Photo, here are some ways you can do so

Free (free of charge)

Free for personal and commercial use.

Author: Awesome Content

Similar Free Stock Images

Colorful Digital Stock Market Graph Over Grid Background
Premium
Displaying transparent data dashboard over field and mountains, with colorful graphs and labels. Data, analytics, visualization, weather, technology, eco, information
Financial Growth Graph Amid Urban Skyline Background
Digital Interface with Data Processing Visualization
Digital Data and Arrows Showcasing Market Trends
Financial Graph and Cityscape Analysis with Technological Overlay
Premium
A vibrant financial chart displays stock market data against a city skyline at dusk, emphasizing dynamic market fluctuations
Futuristic Financial Data Analytics with Digital Interface Concept
Financial Graph Over Ukraine Flag Illustrates Economic Trends
Dynamic Green Line Graph Showing Financial Data Fluctuations
Declining Financial Market Chart Over Grid Background
Premium
Displaying vertical bars rising from grid plane in trading dashboard, with ticker values and arrows. Financial, data, analytics, visualization, digital, technology, investment
Falling Business Graph on Green Digital Background
Digital Financial Data Processing Animation
Digital Data Processing Interface with Green Growth Chart
Financial Market Data with Green Line Graph
Premium
Businessman interacting with digital data dashboard interface, touching colorful charts, graphs, and analytics visualization for marketing performance, business intelligence, financial data analysis.
Green Market Trend Line on Digital Grid Background
Dynamic Financial Graph with Growth Patterns on Digital Screen
Dynamic Forex Market Chart with Multiple Currencies and Growth Trends
Upward Trend in Financial Graph with Digital Icons
Premium
Businessman presenting data analytics with colorful charts on clipboard in a professional setting, focused on communication.
Digital Stock Market Data and Trends Visualization
Fluctuating Financial Graph on Green Grid Background
Financial Data Analysis with Declining Trend on Blueprint Graph
Abstract Sound Wave with Frequency Lines on Concentric Circles
Premium
A dynamic meeting shows professionals engaged in collaborative brainstorming. Colorful charts and data analytics reflect the integration of artificial intelligence in business planning. Trope
Financial Chart with Dynamic Data on Black Grid
Financial Data Charts with Network Connections Digital Interface
Dynamic Digital Stock Market Chart with Growing Financial Trends
Futuristic Data Dashboard Showing Dynamic Red Line Graph
Premium
Showing overlay over hazy skyline with world map, percentage labels, pie and bar charts, data grids. Analytics, visualization, business intelligence, digital interface, urban development
Red Declining Graph on Digital Grid Display Represents Falling Markets
Dynamic Graphs Depicting Financial Trends on Purple Grid Background
Premium
Displaying donut chart showing segmented blue ring on 3D grid plane, numeric labels, copy space. Data, analytics, visualization, dashboard, technology, digital, infographic
Data Analysis Process with Green Digital Interface
Digital Stock Market Trends and Financial Growth Analysis
Fluctuating Financial Graph With Data Visualization
Financial Data on USA Flag Background Symbolizing Economics
Premium
Displaying stacked bar chart with colored segments on dark cloudy sky background with white axes. Data, analytics, visualization, infographic, digital, modern, abstract
Ukraine Economic Crisis with Financial Graph Overlay
Financial Market Growth Over City Skyline
Green Financial Line Graph with Candlestick Data on Grid Background
Abstract Neon Shapes over Financial Data Screen
Premium
Projecting translucent bar charts across futuristic corridor pillars, with glossy floor reflections. Technology, innovation, data, analytics, visualization, modern, digital
Dynamic Financial Growth Graph on Blue Grid Background
Dynamic Data Chart on Dark Digital Background
Financial Growth Chart with Dynamic Green Line on Grid Overlay
Declining Stock Market Graph with Red Trend Line
Premium
Business report summary on clipboard with colorful bar charts, pie chart, and pen on wooden table. Financial analysis, marketing data, performance review, annual report concept background.
Digital Data Analytics with Financial Graphs and Indigo Background
Dynamic Graph Illustration Depicting Financial Growth
Digital Financial Data Analytics on Dark Interface
Dynamic Financial Data on Dark Background With Colorful Graphs
Premium
Displaying financial data fluctuating on dashboard with turquoise line, data labels and golden arc. Data visualization, analytics, modern design, technological, data analytics, dashboard
Data Processing with Abstract Graph and Digital Interface
Fluctuating Financial Graph on Digital Orange Background
Digital Data Stream with Code Overlay on Technical Graph
Armenian Flag with Financial Graph Overlay Depicting Market Trends
Premium
Smiling woman in green sweater holding cup pointing at charts at meeting, map overlays, copy space. Collaboration, office, boardroom, teamwork, data, analytics, color
Colorful Numbers with Zigzag Pattern on Purple Background
Dynamic Graphs and Charts on Technology Background
Colorful Financial Data Charts on Digital Grid Background
Global Market Downtrend with Red Graph Line Illustration
Dynamic Financial Data with Red Line on Digital Interface
Dynamic Financial Data Graph Showing Market Trends
Premium
Displaying bar chart descending on dark blue backdrop, with grid overlay, red arrow and trend line. Data, analytics, visualization, charts, infographic, digital, technology
Financial Data Chart Over City Silhouette
Declining Graph with 49% Reduction on Dark Digital Background
Economic Trends Depicting Ukraine Crisis Concept
Digital Financial Data Analytics and Economic Trends
Premium
Developer silhouette interacting with phone in tech office, reviewing code overlay and data graphs. Technology, data, analytics, visualization, coding, digital, innovation
Growth Trend with Green Line Overlay and Modern Cityscape
Rising Green Line Chart Overlays Concept of Financial Growth
Declining Graph Overlay on Night Traffic Scene Illustrates Downtrend
Digital Financial Data and Global Market Analysis on Graph
Premium
Digital AI and data analytics visualized through a magnifying glass with colorful graphs and statistics,symbolizing the power of AI technology in improving data-driven business strategies and insight.
Dynamic Financial Data Representation on Digital Grid
Financial Data Overlaid on Night Cityscape with Red Trend Line
Digital Finance Art with Graphs and Currency Symbols Overlapping
Data Analytics Graph with Redline Trends on Grid Background
Premium
Urban cityscape with tall buildings, overlaid with colorful data graphs and charts, depicting financial growth and analytics on a bright day. Concept of modern technology impacting urban environments
Dynamic Red Line Graph on Digital Data Grid Background
Dynamic Financial Chart with Red Line Graph on Digital Interface
Financial Graph Over Radar Screen Indicating Market Trends
Digital Interface with Overlapping Code and Graph
Premium
Professionals reviewing reports and color coded folders in office, with floating charts. Business, productivity, data, analytics, teamwork, collaboration, modern
Analyzing Growing Graph Line on Purple Gradient Background
Stock Market Decline Data Analysis on Dark Grid Background
Dynamic Diagrams of Data Processing on Digital Interface
Digital Representation of DNA Structures in Abstract Motion
Premium
Standing clinician in white coat with glasses and stethoscope in exam room, data overlaying devices. Physician, clinic, holographic, doubleexposure, analytics, visualization, portrait
Digital Data Dashboard with Transparent Financial Graphs
Colorful Line Graphs with Candlestick Markers on Digital Interface
Dynamic Financial Graphs with Statistical Data on Blue Grid
Dynamic Financial Graph with Changeable Metrics Over Green Line
Digital Data Processing Interface with Code and Graph
Digital Currency Trading Interface with Data Visualization
Premium
Showing dashboard plotting line and bar charts on blue grid, with world map and numeric overlays. Analytics, visualization, data, technology, finance, dashboards, growth
Mathematical Formulas and Red Line Graph in Foggy Background
Futuristic Data Visualization Chart with Digital Mountain Peaks
Cryptocurrency Growth Chart Over Digital World Map
Economic Data Analysis Graph over Gabon Flag Background
Premium
Data science analytics and big data technology concept
Green Financial Line Chart Over Modern Office Buildings
Financial Statistics Superimposed on 3D Model
Digital Lock with Real-Time Data Display
Green Data Graph on Black Digital Interface
Premium
Displaying finance dashboard on dark themed GUI, with vertical bar chart and curved line graph. Data analytics, finance, investment, data visualization, technology, dashboard, digital interface
Holographic Stock Market Analysis with Charts and Data
Data Processing Interface with Analytic Visuals on World Map
Dynamic Stock Market Data Chart with Trend Line
Computerized Analysis Over Futuristic Cityscape Background
Premium
Businessman typing on laptop with digital data analytics dashboard, colorful charts, and AI interface. Concept of big data, financial technology, performance metrics, and digital transformation.
Sharp Decline in Stock Market Graph Against Red Financial Data Background
Colorful Financial Graphs on Digital Grid Background
Global Financial Data and Stock Market Trends on World Map
Futuristic DNA Strand and Data Analytics Interface Concept
Premium
A businessman analyzing a colorful pie chart dashboard on a laptop, representing data analytics, performance tracking, financial report, and business insight visualization.
Digital Decline Graphic with QR Code Elements and Red Line
Dynamic Financial Data Analysis Concept with Graph Lines and Orange Background
Abstract Financial Data and Analysis Concept Background
Abstract Neon Shapes on Black Futuristic Background
Premium
Digital organization chart with team structure, gender distribution pie chart, and colorful data graphs floating over laptop. Concept of business analytics and HR management.
Dynamic Line Graph Displaying Data Trends on Beige Grid Background