- Home >
- Stock Photos >
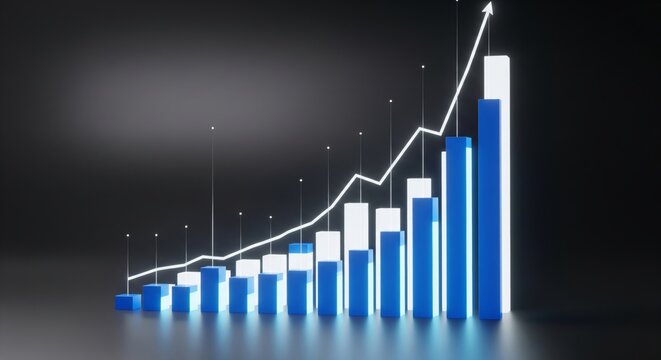
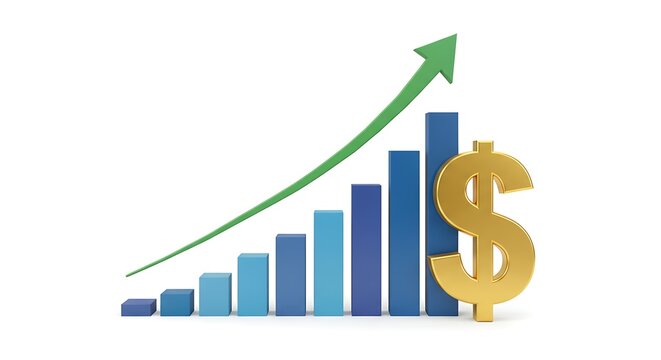
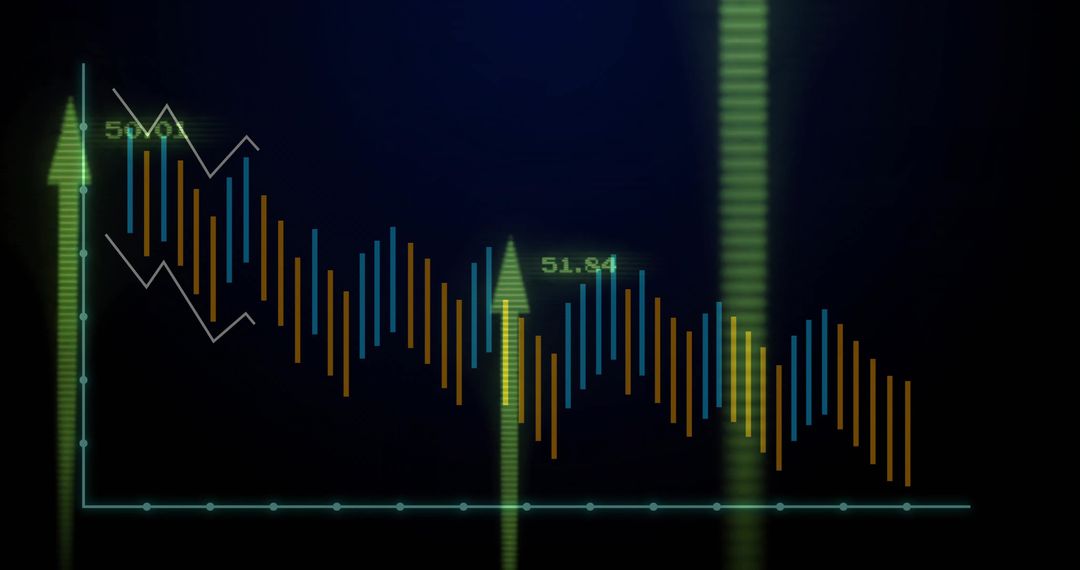
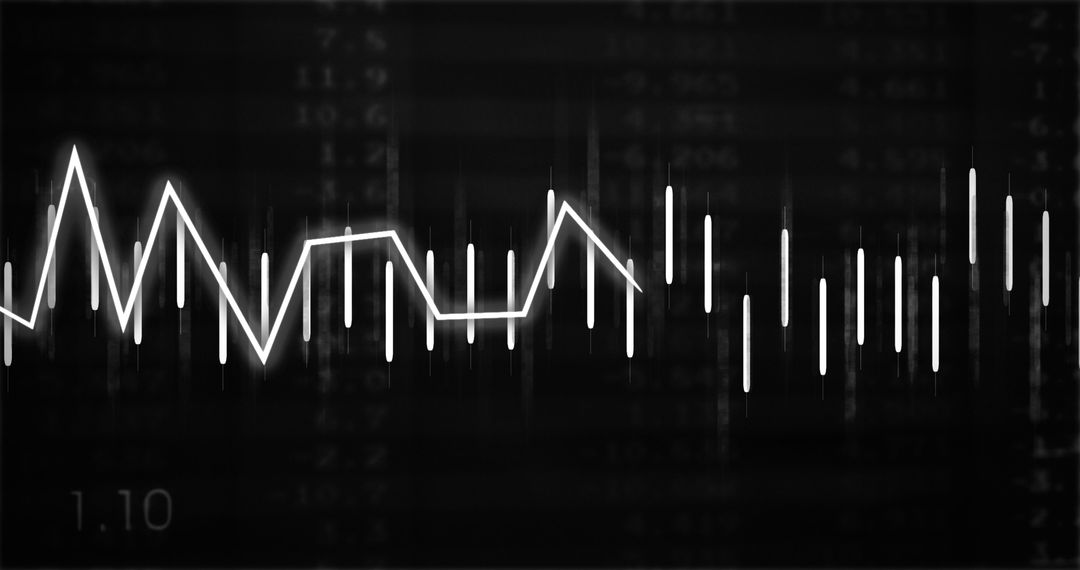
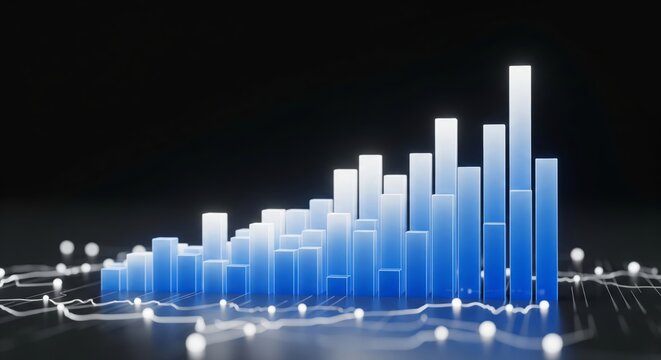
- Colorful Bar Graph on Dark Background Illustrates Data Trends
Colorful Bar Graph on Dark Background Illustrates Data Trends Image

Vibrant bar graph displaying financial or statistical information over dark navy background, ideal for illustrating data trends and analyses in presentations, reports, blogs, and articles related to finance, economy, technology, or market research. Enhances visual appeal in business contexts and supports storytelling with visual data interpretation.
Powered by 


2
downloads
downloads
Tags:
More
Credit Photo
If you would like to credit the Photo, here are some ways you can do so
Text Link
photo Link
<span class="text-link">
<span>
<a target="_blank" href=https://pikwizard.com/photo/colorful-bar-graph-on-dark-background-illustrates-data-trends/c1ea10267f8b08713d88dd3cf3a3382b/>PikWizard</a>
</span>
</span>
<span class="image-link">
<span
style="margin: 0 0 20px 0; display: inline-block; vertical-align: middle; width: 100%;"
>
<a
target="_blank"
href="https://pikwizard.com/photo/colorful-bar-graph-on-dark-background-illustrates-data-trends/c1ea10267f8b08713d88dd3cf3a3382b/"
style="text-decoration: none; font-size: 10px; margin: 0;"
>
<img src="https://pikwizard.com/pw/medium/c1ea10267f8b08713d88dd3cf3a3382b.jpg" style="margin: 0; width: 100%;" alt="" />
<p style="font-size: 12px; margin: 0;">PikWizard</p>
</a>
</span>
</span>
Free (free of charge)
Free for personal and commercial use.
Author: People Creations
Similar Free Stock Images

Premium


Premium


Premium


Premium


Premium


Premium


Premium


Premium


Premium


Premium


Premium


Premium


Premium


Premium


Premium


Premium


Premium


Premium


Premium


Premium


Premium


Premium


Premium


Premium