- Home >
- Stock Photos >
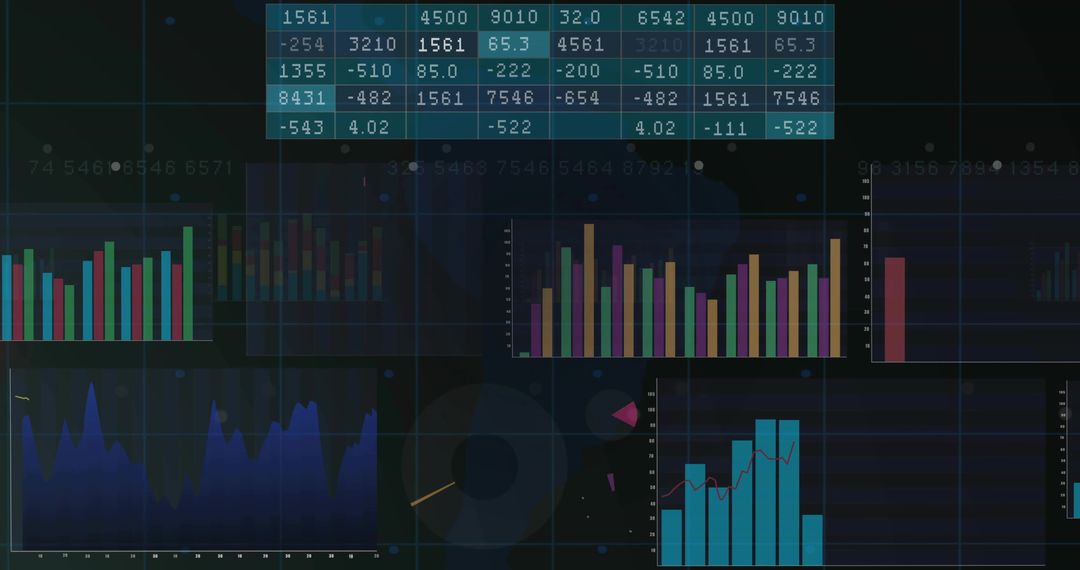
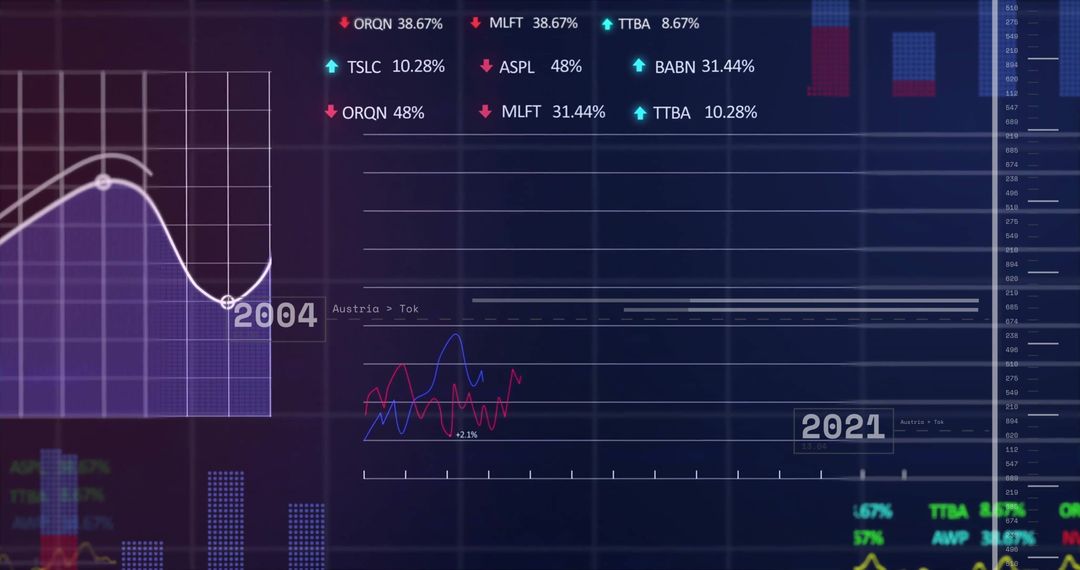
- Colorful Bar Graph with Digital Financial Data Analysis Display
Colorful Bar Graph with Digital Financial Data Analysis Display Image

Colorful bar graph overlays digital financial data on dark background, depicting analytical trends and market movements. Ideal for presentations on finance technology, investment strategies, and economic research, as well as articles about digital analysis tools in finance.
Powered by  - Get 15% off with code: PIKWIZARD15


2
downloads
downloads
Tags:
More
Credit Photo
If you would like to credit the Photo, here are some ways you can do so
Text Link
photo Link
<span class="text-link">
<span>
<a target="_blank" href=https://pikwizard.com/photo/colorful-bar-graph-with-digital-financial-data-analysis-display/bc4835ce66070614bb1d05c5bb4269ff/>PikWizard</a>
</span>
</span>
<span class="image-link">
<span
style="margin: 0 0 20px 0; display: inline-block; vertical-align: middle; width: 100%;"
>
<a
target="_blank"
href="https://pikwizard.com/photo/colorful-bar-graph-with-digital-financial-data-analysis-display/bc4835ce66070614bb1d05c5bb4269ff/"
style="text-decoration: none; font-size: 10px; margin: 0;"
>
<img src="https://pikwizard.com/pw/medium/bc4835ce66070614bb1d05c5bb4269ff.jpg" style="margin: 0; width: 100%;" alt="" />
<p style="font-size: 12px; margin: 0;">PikWizard</p>
</a>
</span>
</span>
Free (free of charge)
Free for personal and commercial use.
Author: Creative Art
Similar Free Stock Images

Premium


Premium


Premium


Premium


Premium


Premium


Premium


Premium


Premium


Premium


Premium


Premium


Premium


Premium


Premium


Premium


Premium


Premium


Premium


Premium


Premium


Premium


Premium


Premium