- Home >
- Stock Photos >
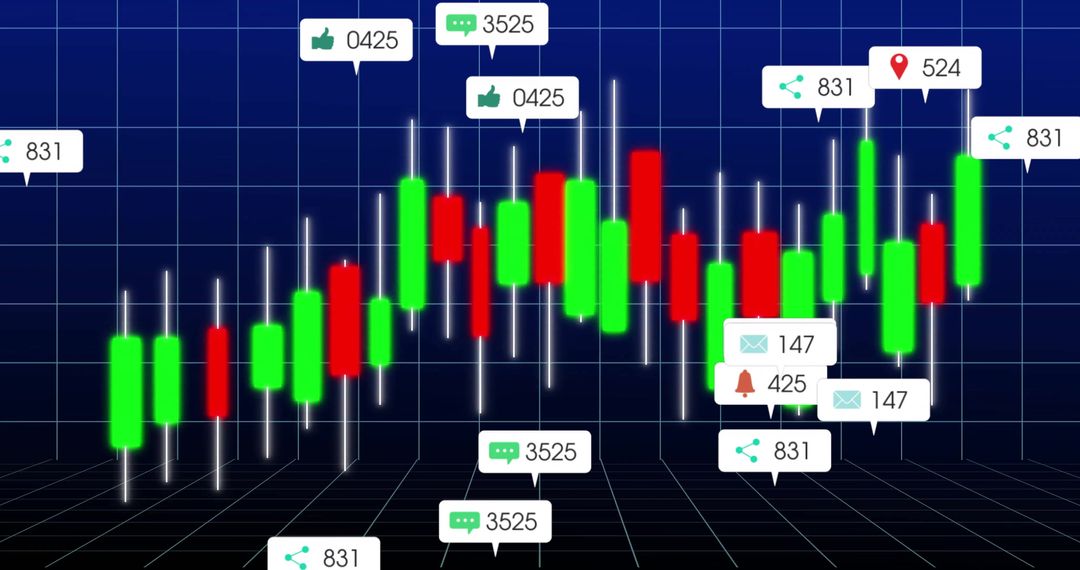
- Colorful Candlestick Chart on Trading Interface
Colorful Candlestick Chart on Trading Interface Image

Dynamic depiction of a candlestick chart displaying market trends with bright colored candles and clear timestamps. Suitable for illustrating concepts related to trading, financial analysis, and stock market strategies. Ideal for use in financeblogs, trading software mockups, and educational materials about market analytics.
Powered by 


0
downloads
downloads
Tags:
More
Credit Photo
If you would like to credit the Photo, here are some ways you can do so
Text Link
photo Link
<span class="text-link">
<span>
<a target="_blank" href=https://pikwizard.com/photo/colorful-candlestick-chart-on-trading-interface/c07e580e43ba8759e198ebd558f94301/>PikWizard</a>
</span>
</span>
<span class="image-link">
<span
style="margin: 0 0 20px 0; display: inline-block; vertical-align: middle; width: 100%;"
>
<a
target="_blank"
href="https://pikwizard.com/photo/colorful-candlestick-chart-on-trading-interface/c07e580e43ba8759e198ebd558f94301/"
style="text-decoration: none; font-size: 10px; margin: 0;"
>
<img src="https://pikwizard.com/pw/medium/c07e580e43ba8759e198ebd558f94301.jpg" style="margin: 0; width: 100%;" alt="" />
<p style="font-size: 12px; margin: 0;">PikWizard</p>
</a>
</span>
</span>
Free (free of charge)
Free for personal and commercial use.
Author: People Creations
Similar Free Stock Images

Premium


Premium


Premium


Premium


Premium


Premium


Premium


Premium


Premium


Premium


Premium


Premium


Premium


Premium


Premium


Premium


Premium


Premium


Premium


Premium


Premium


Premium


Premium


Premium