- Home >
- Stock Photos >
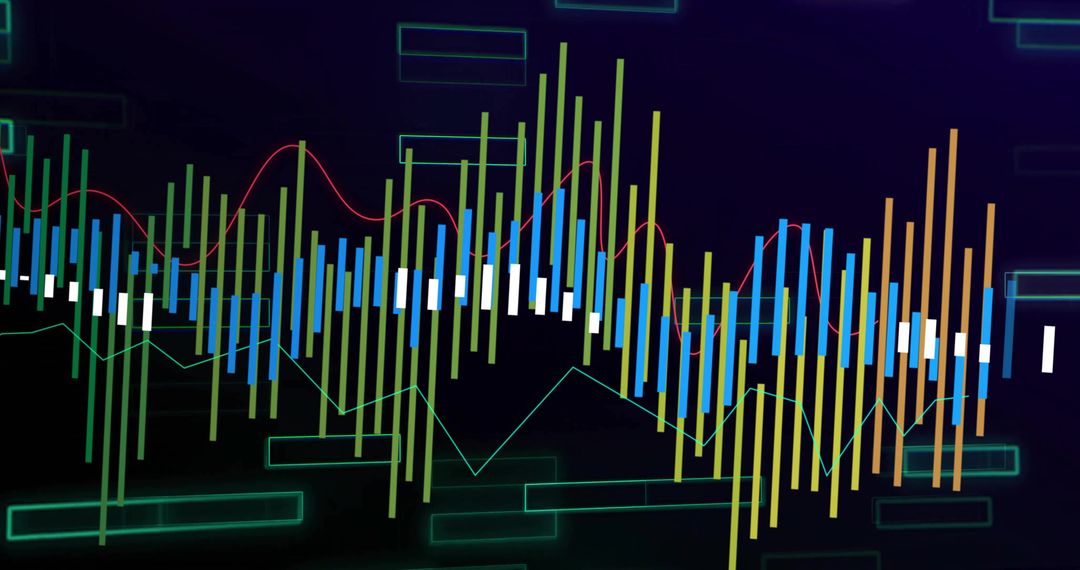
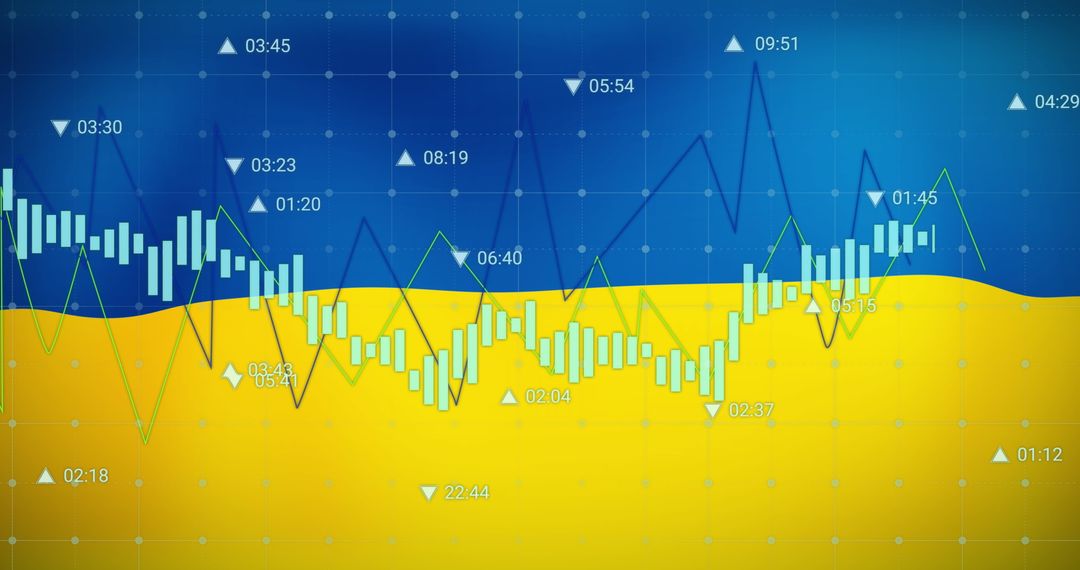
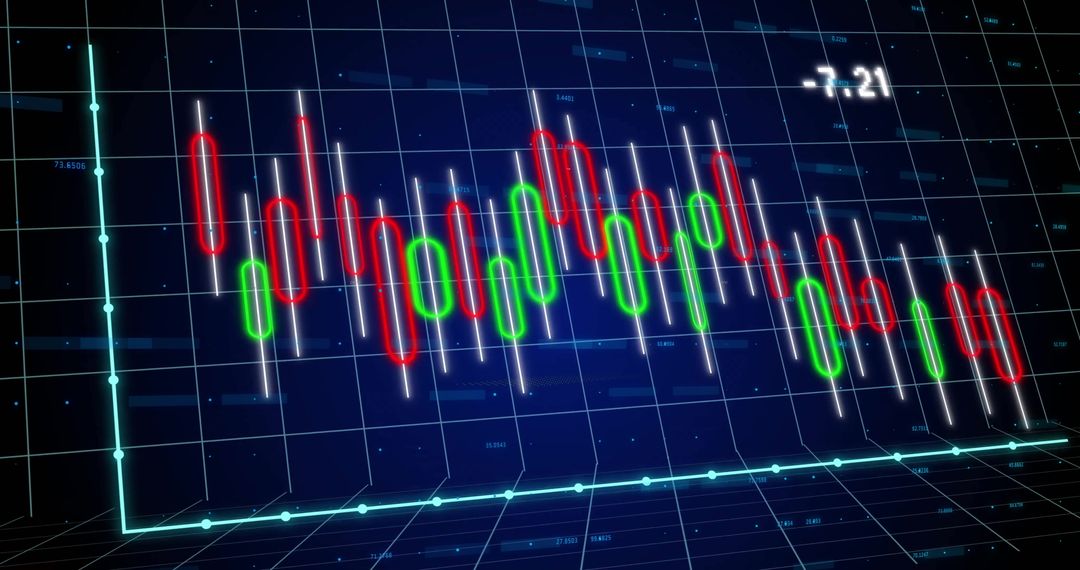
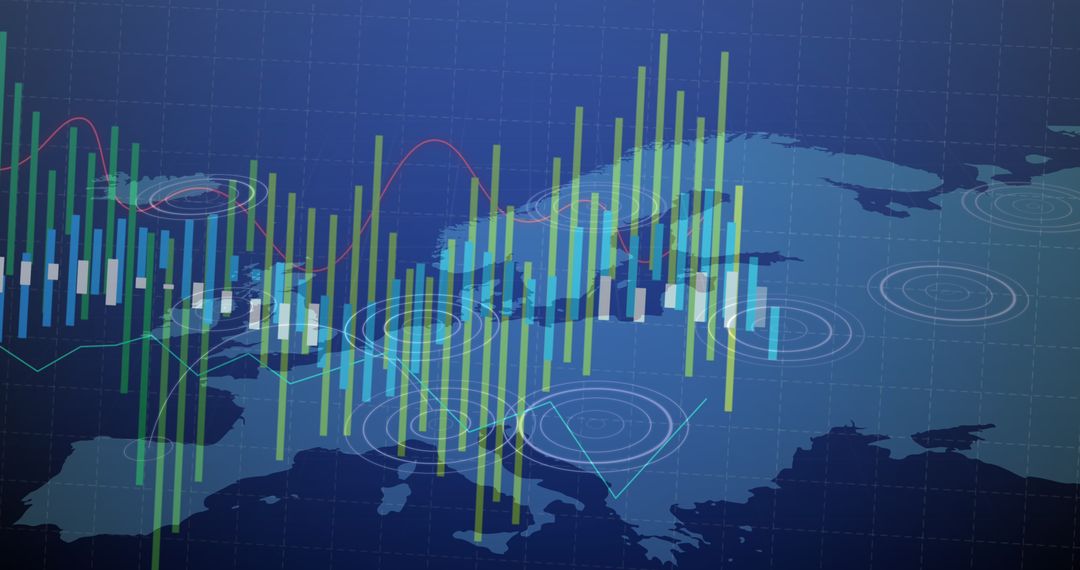
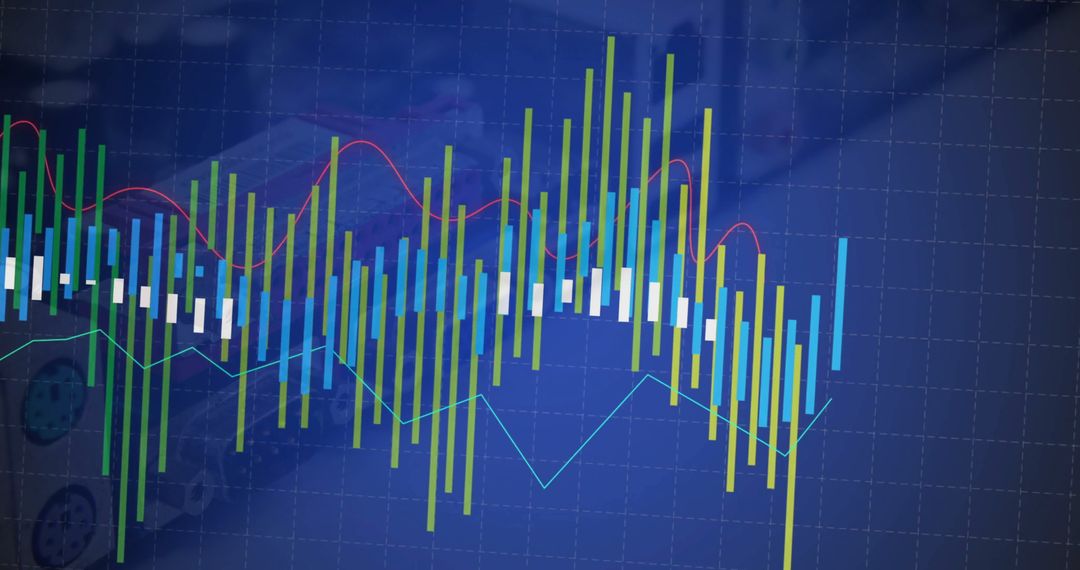
- Colorful Candlestick Chart With Trend Lines on Digital Background
Colorful Candlestick Chart With Trend Lines on Digital Background Image

Illustrates concepts of financial markets, trading and investment strategy with multicolored candlesticks and trend lines symbolizing data movement. Suitable for articles, presentations and educational materials in finance, analytics and data science illustrating digital methodologies and financial forecasting.
Powered by  - Get 15% off with code: PIKWIZARD15


0
downloads
downloads
Tags:
More
Credit Photo
If you would like to credit the Photo, here are some ways you can do so
Text Link
photo Link
<span class="text-link">
<span>
<a target="_blank" href=https://pikwizard.com/photo/colorful-candlestick-chart-with-trend-lines-on-digital-background/d8d1d28d3cff80af8efb56e63526eeb5/>PikWizard</a>
</span>
</span>
<span class="image-link">
<span
style="margin: 0 0 20px 0; display: inline-block; vertical-align: middle; width: 100%;"
>
<a
target="_blank"
href="https://pikwizard.com/photo/colorful-candlestick-chart-with-trend-lines-on-digital-background/d8d1d28d3cff80af8efb56e63526eeb5/"
style="text-decoration: none; font-size: 10px; margin: 0;"
>
<img src="https://pikwizard.com/pw/medium/d8d1d28d3cff80af8efb56e63526eeb5.jpg" style="margin: 0; width: 100%;" alt="" />
<p style="font-size: 12px; margin: 0;">PikWizard</p>
</a>
</span>
</span>
Free (free of charge)
Free for personal and commercial use.
Author: People Creations
Similar Free Stock Images

Premium


Premium


Premium


Premium


Premium


Premium


Premium


Premium


Premium


Premium


Premium


Premium


Premium


Premium


Premium


Premium


Premium

Premium


Premium


Premium


Premium


Premium


Premium


Premium