- Home >
- Stock Photos >
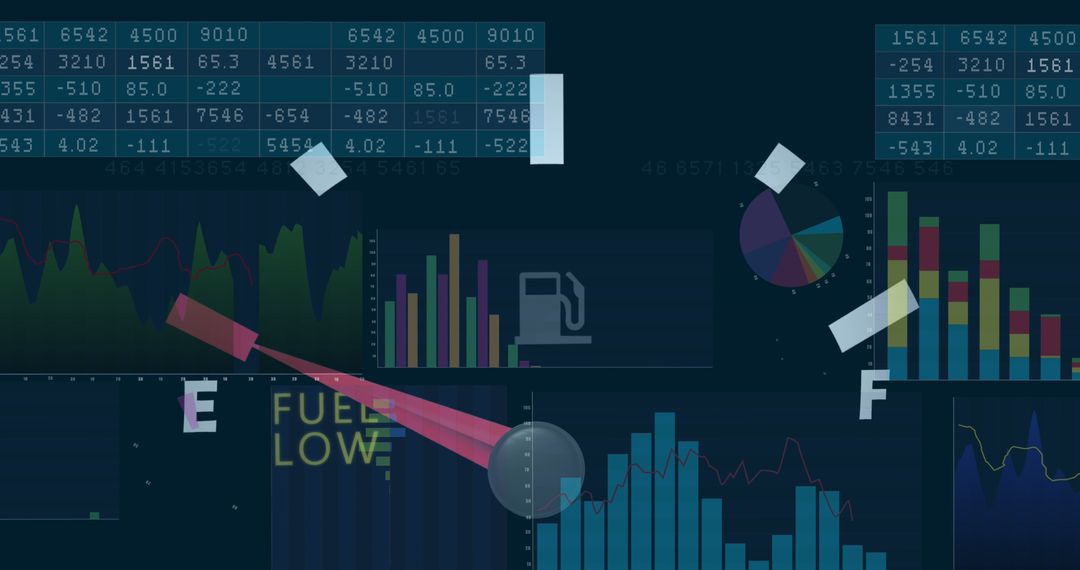
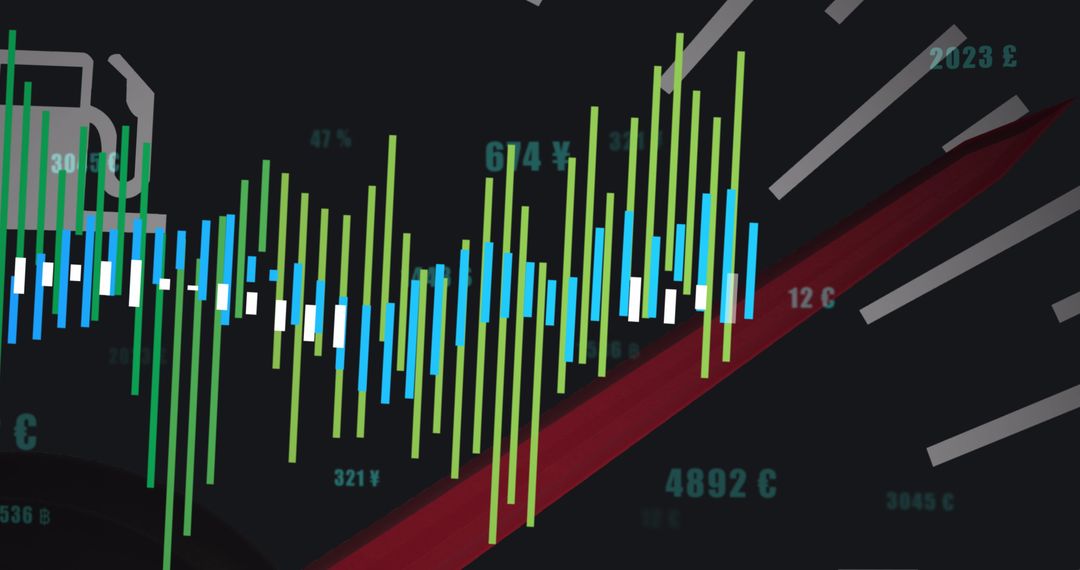
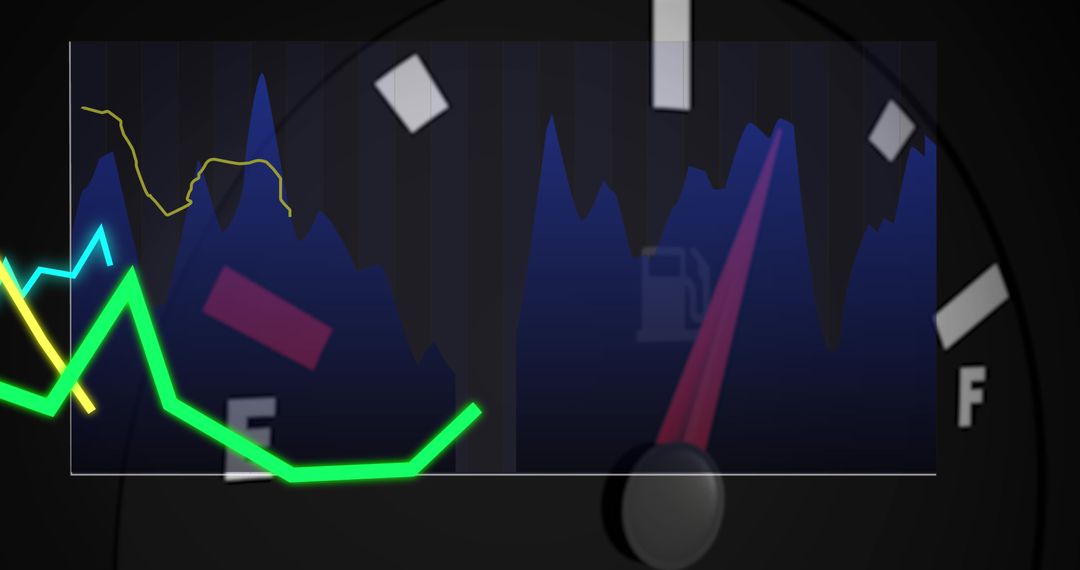
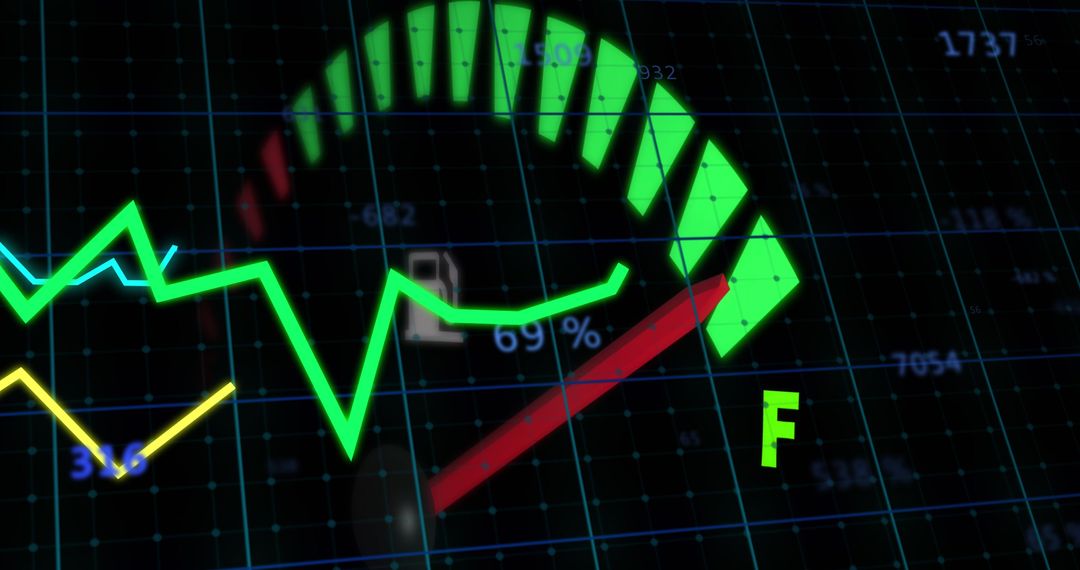
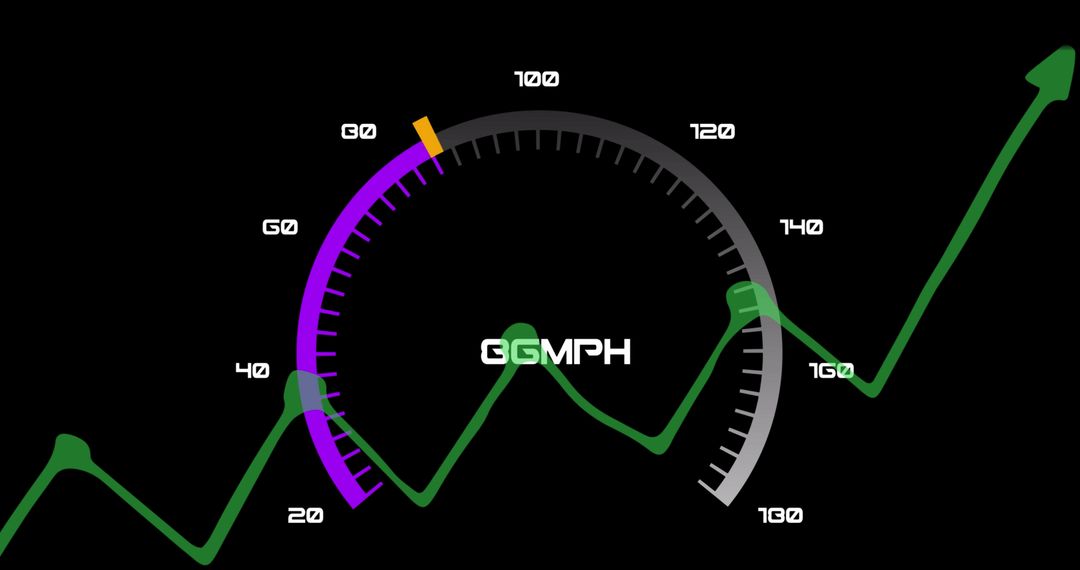
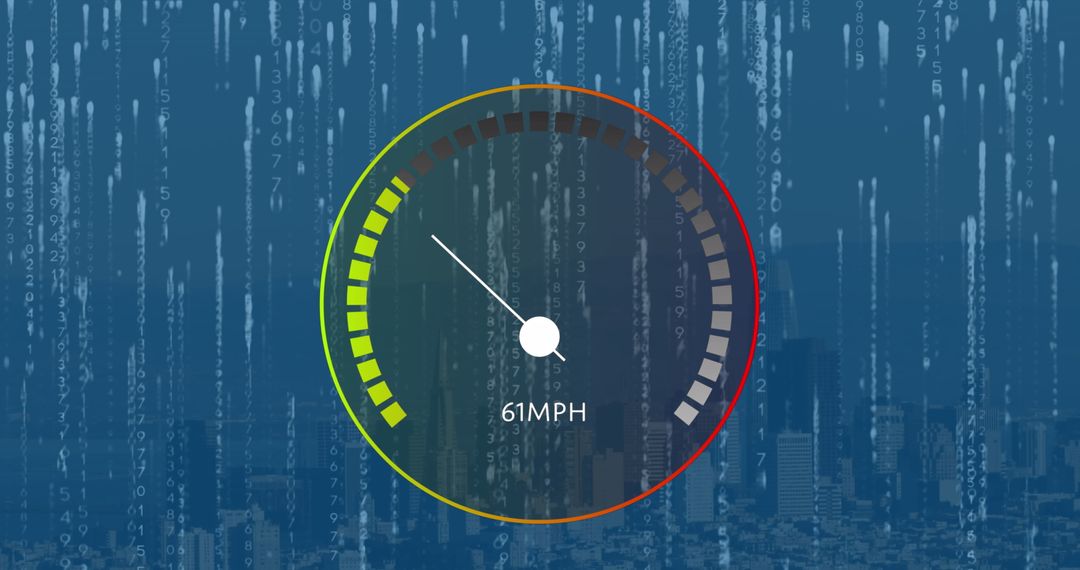
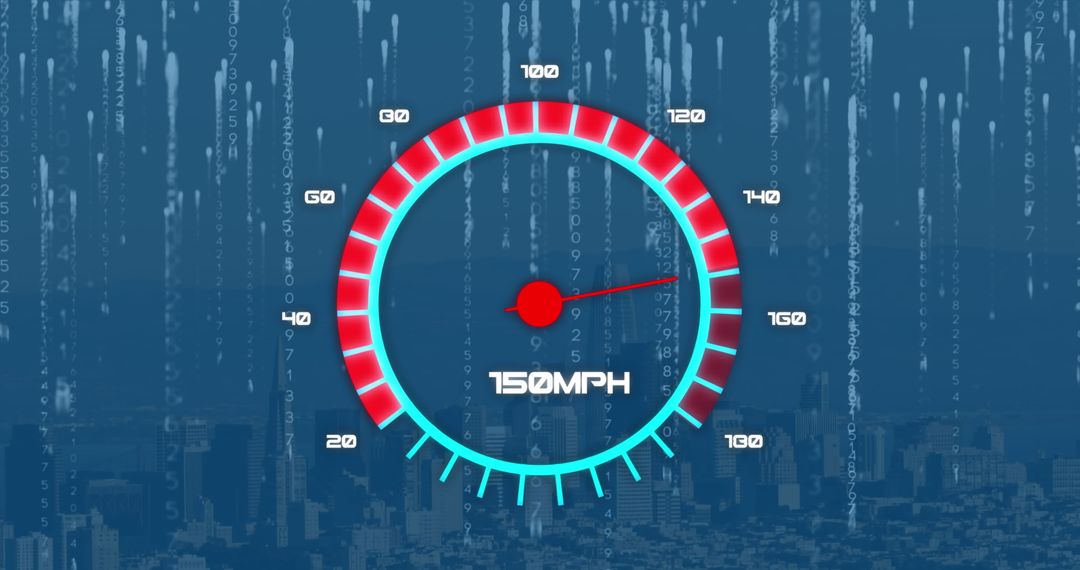
- Colorful Speedometer Overlay on Digital Graph
Colorful Speedometer Overlay on Digital Graph Image

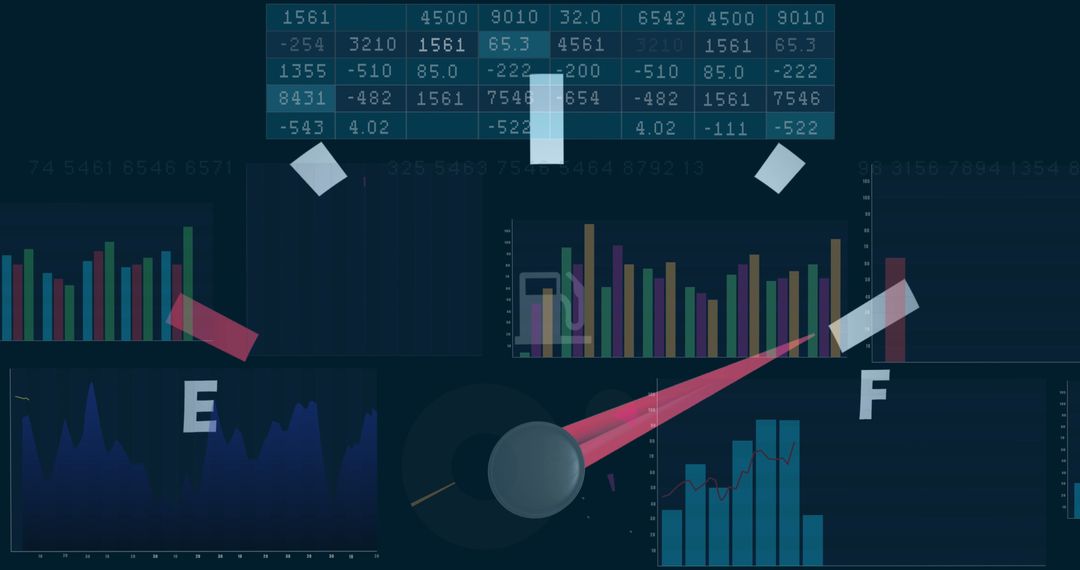
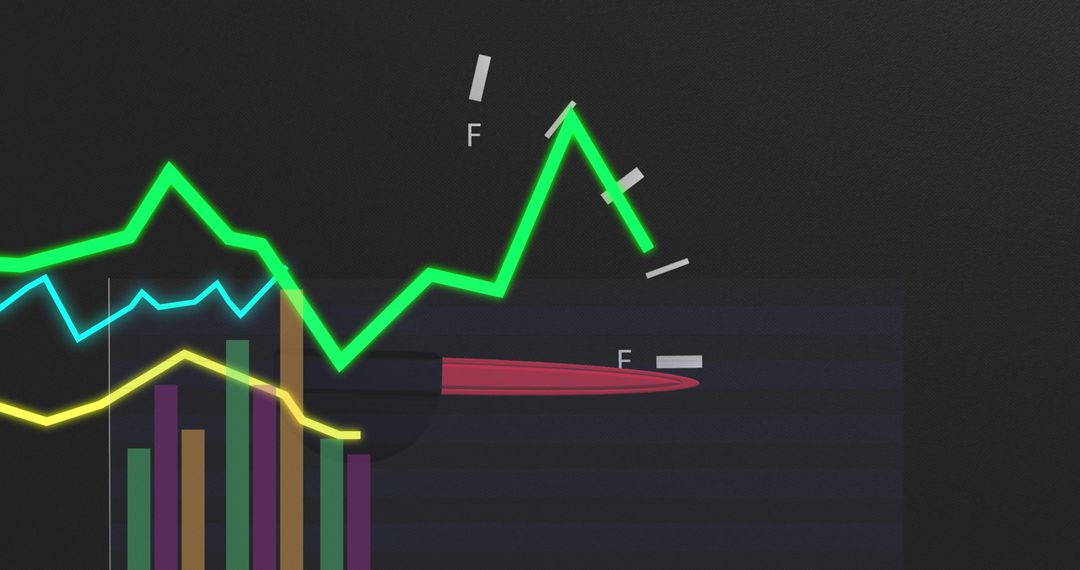
Vibrant speedometer illustration hovers over a dynamic digital data graph, symbolizing fast data processing and performance evaluation in a business context. Suitable for concepts focusing on technology, financial analytical tools, business efficiency, digital transformation, or statistics presentations.
Powered by 


2
downloads
downloads
Tags:
More
Credit Photo
If you would like to credit the Photo, here are some ways you can do so
Text Link
photo Link
<span class="text-link">
<span>
<a target="_blank" href=https://pikwizard.com/photo/colorful-speedometer-overlay-on-digital-graph/f7964f53e58130f554ae82c946d92afe/>PikWizard</a>
</span>
</span>
<span class="image-link">
<span
style="margin: 0 0 20px 0; display: inline-block; vertical-align: middle; width: 100%;"
>
<a
target="_blank"
href="https://pikwizard.com/photo/colorful-speedometer-overlay-on-digital-graph/f7964f53e58130f554ae82c946d92afe/"
style="text-decoration: none; font-size: 10px; margin: 0;"
>
<img src="https://pikwizard.com/pw/medium/f7964f53e58130f554ae82c946d92afe.jpg" style="margin: 0; width: 100%;" alt="" />
<p style="font-size: 12px; margin: 0;">PikWizard</p>
</a>
</span>
</span>
Free (free of charge)
Free for personal and commercial use.
Author: Awesome Content
Similar Free Stock Images

Premium

Premium


Premium


Premium


Premium


Premium


Premium


Premium


Premium


Premium


Premium


Premium


Premium


Premium


Premium


Premium


Premium


Premium


Premium


Premium


Premium


Premium


Premium


Premium