
- Home >
- Stock Photos >
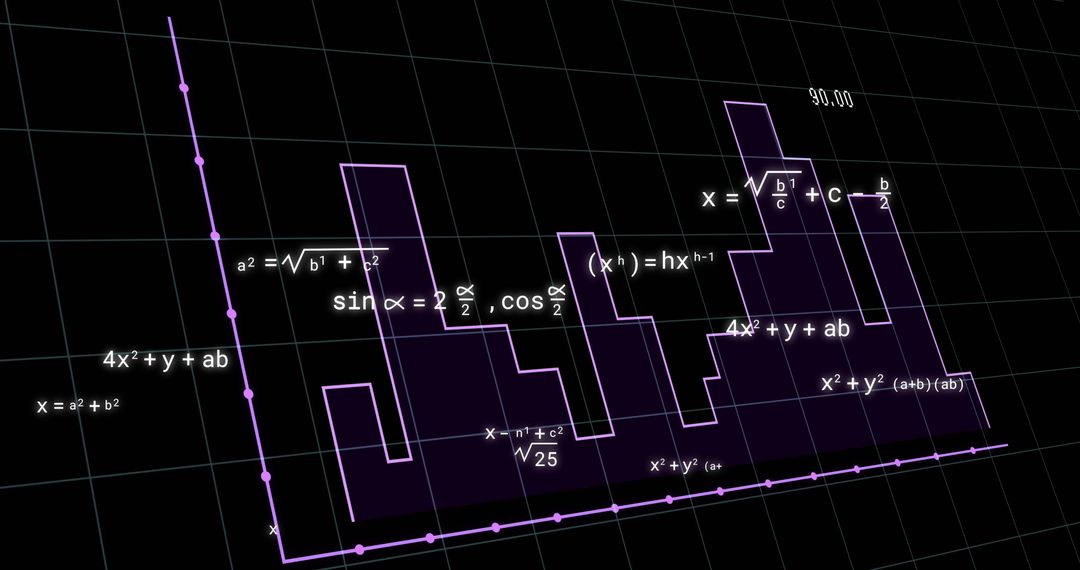
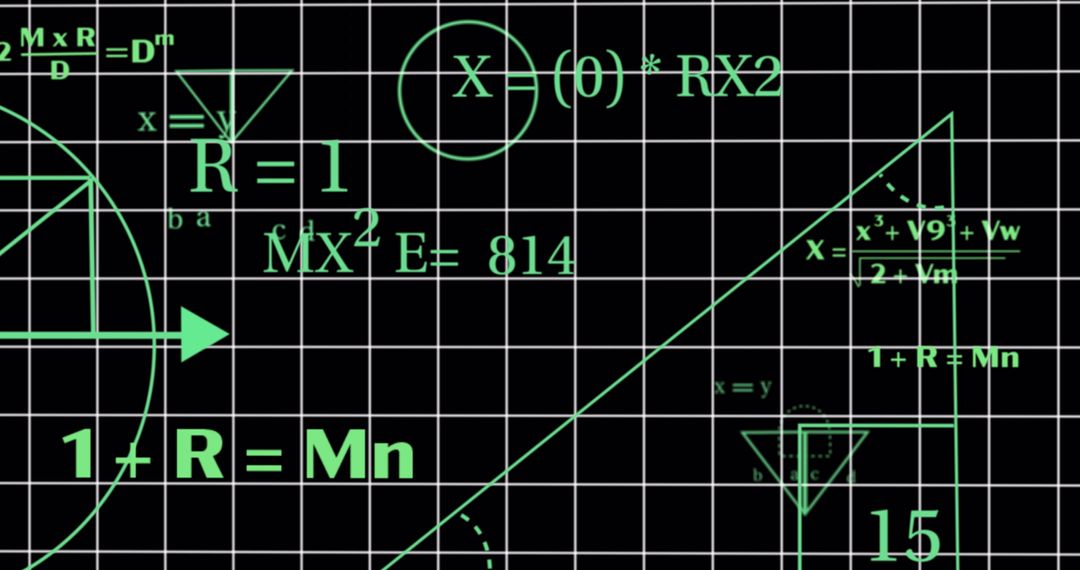
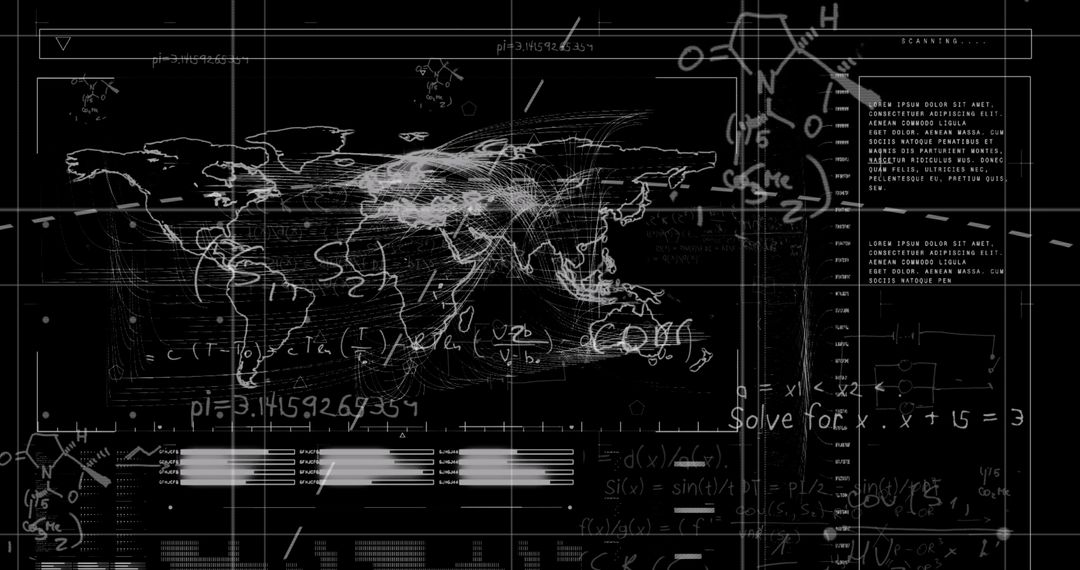
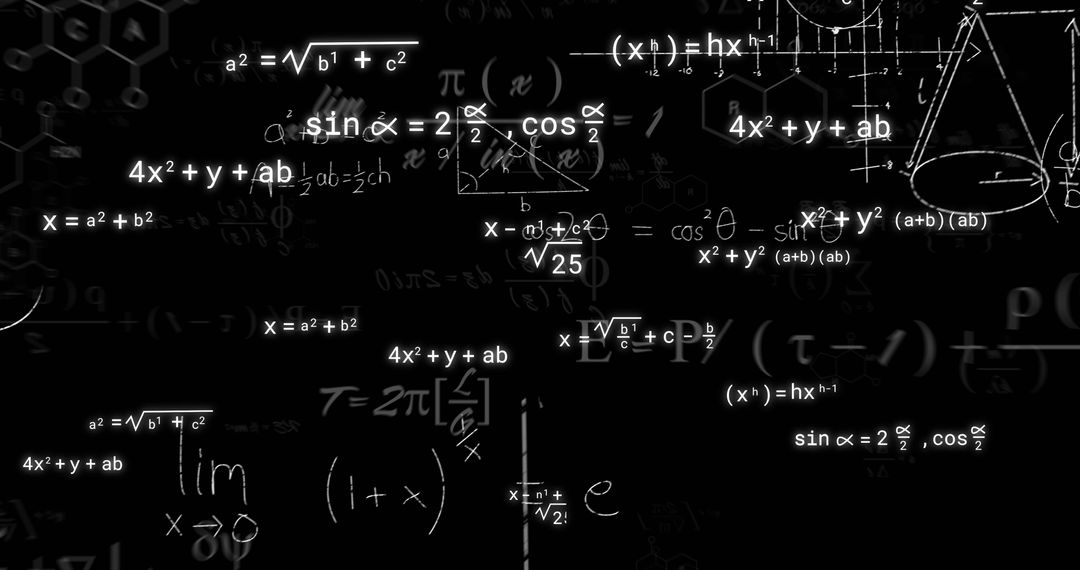
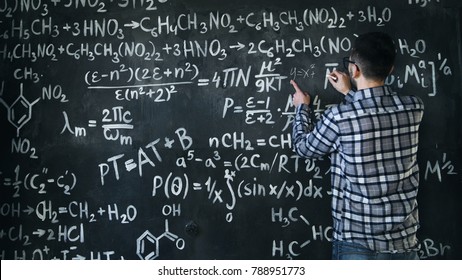
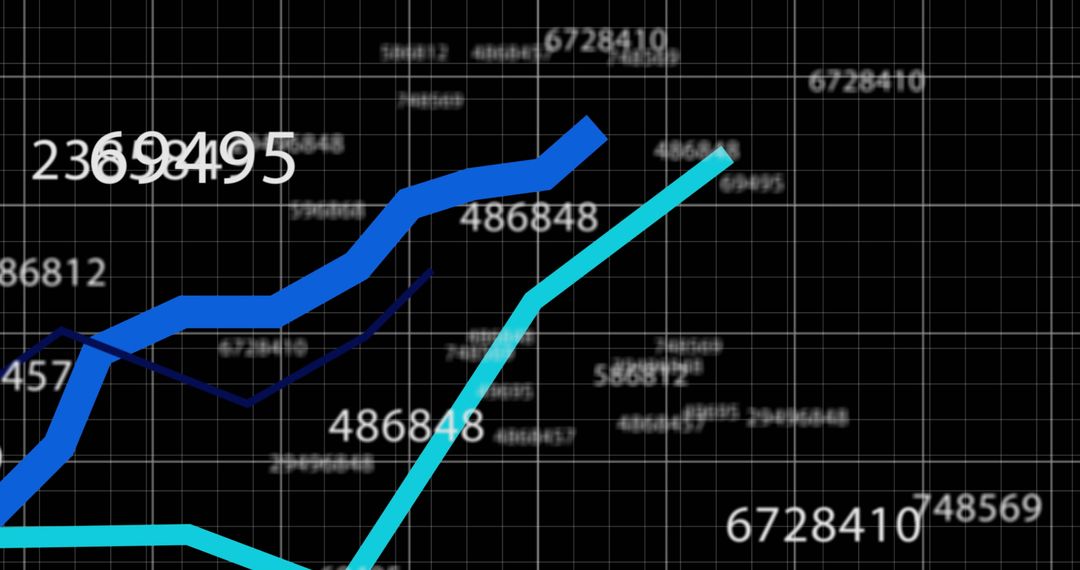
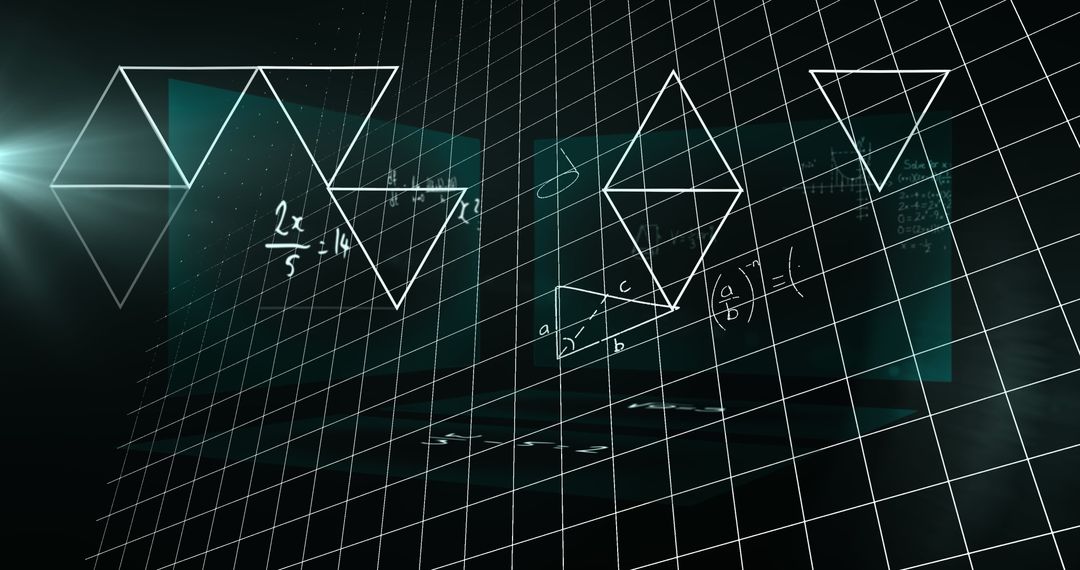
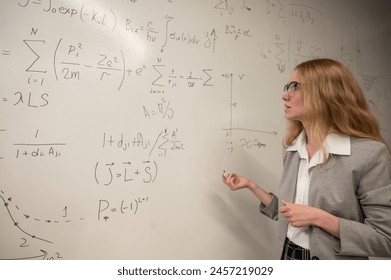
- Complex Chemical Formulas and Math Equations on Grid
Complex Chemical Formulas and Math Equations on Grid Image
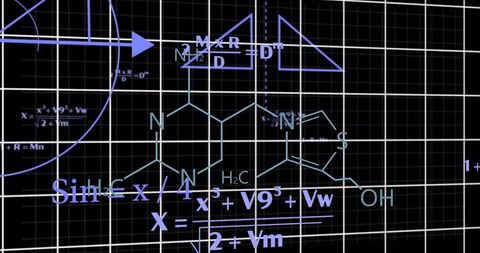
Illustrating intricate chemical formulas and mathematical equations against a dark grid background, suitable for educational materials, scientific presentations, and technology-themed designs. This technical illustration highlights the seamless blend of science and mathematics, making it ideal for conveying ideas in fields like engineering and research.
Powered by  - Get 15% off with code: PIKWIZARD15


2
downloads
downloads
Tags:
More
Credit Photo
If you would like to credit the Photo, here are some ways you can do so
Text Link
photo Link
<span class="text-link">
<span>
<a target="_blank" href=https://pikwizard.com/photo/complex-chemical-formulas-and-math-equations-on-grid/5af9e0dae85000da08c9d47354a0ed29/>PikWizard</a>
</span>
</span>
<span class="image-link">
<span
style="margin: 0 0 20px 0; display: inline-block; vertical-align: middle; width: 100%;"
>
<a
target="_blank"
href="https://pikwizard.com/photo/complex-chemical-formulas-and-math-equations-on-grid/5af9e0dae85000da08c9d47354a0ed29/"
style="text-decoration: none; font-size: 10px; margin: 0;"
>
<img src="https://pikwizard.com/pw/medium/5af9e0dae85000da08c9d47354a0ed29.jpg" style="margin: 0; width: 100%;" alt="" />
<p style="font-size: 12px; margin: 0;">PikWizard</p>
</a>
</span>
</span>
Free (free of charge)
Free for personal and commercial use.
Author: People Creations
Similar Free Stock Images

Premium


Premium


Premium


Premium


Premium


Premium


Premium


Premium


Premium


Premium


Premium


Premium


Premium


Premium


Premium


Premium


Premium


Premium


Premium


Premium


Premium


Premium


Premium


Premium

