- Home >
- Stock Photos >
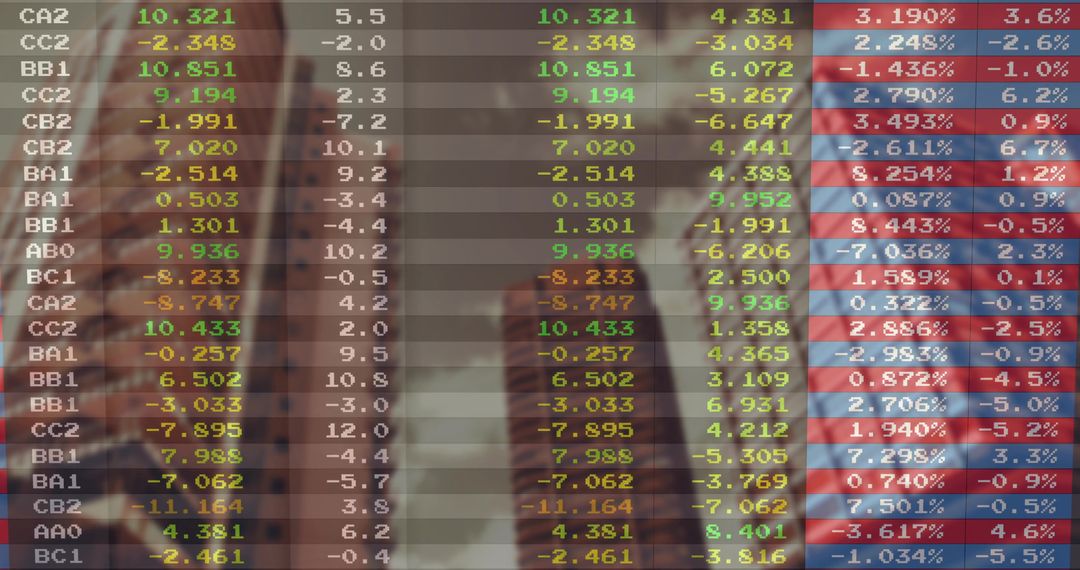
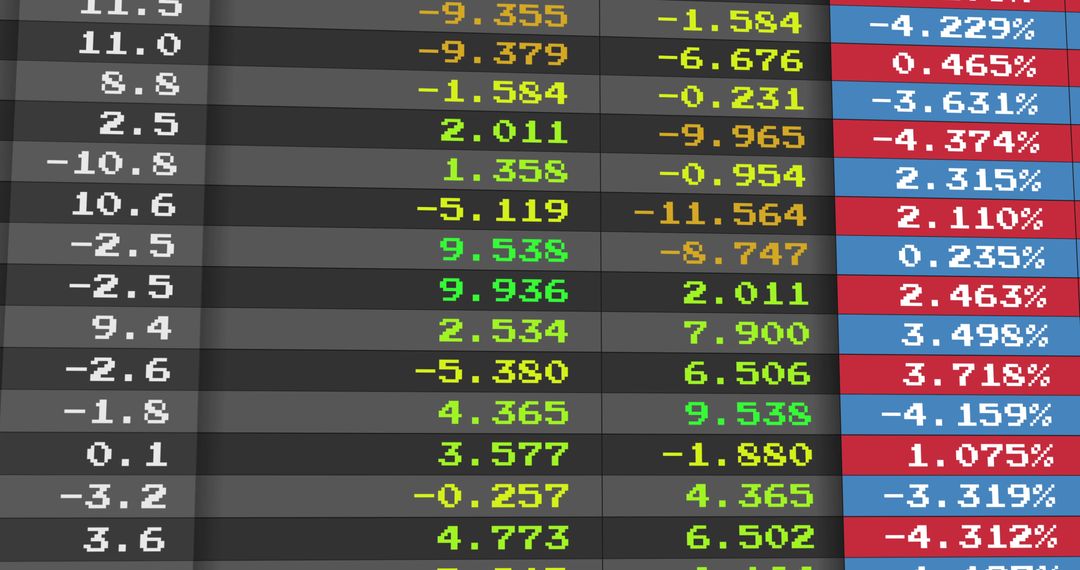
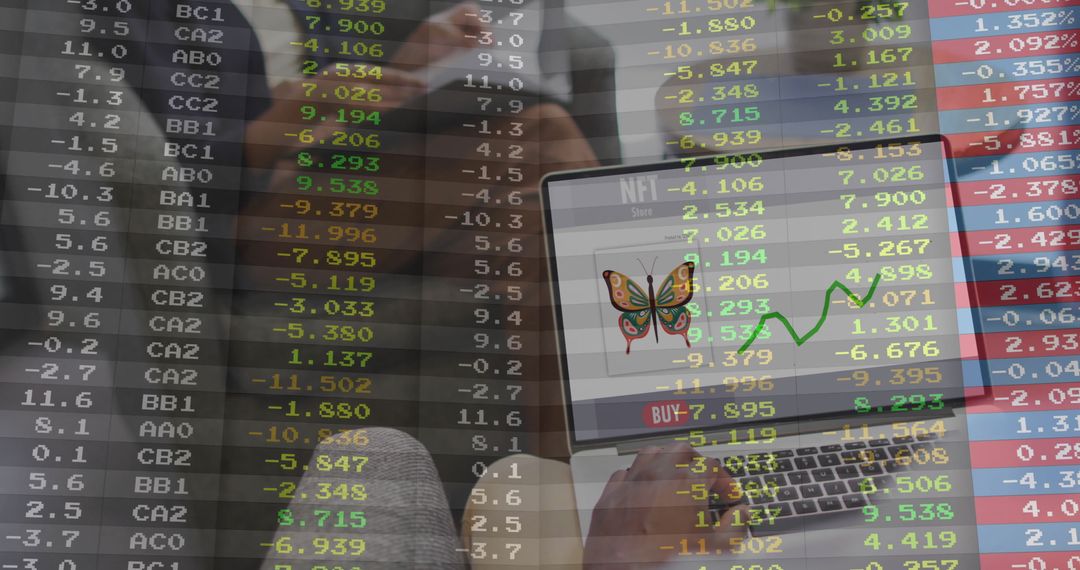
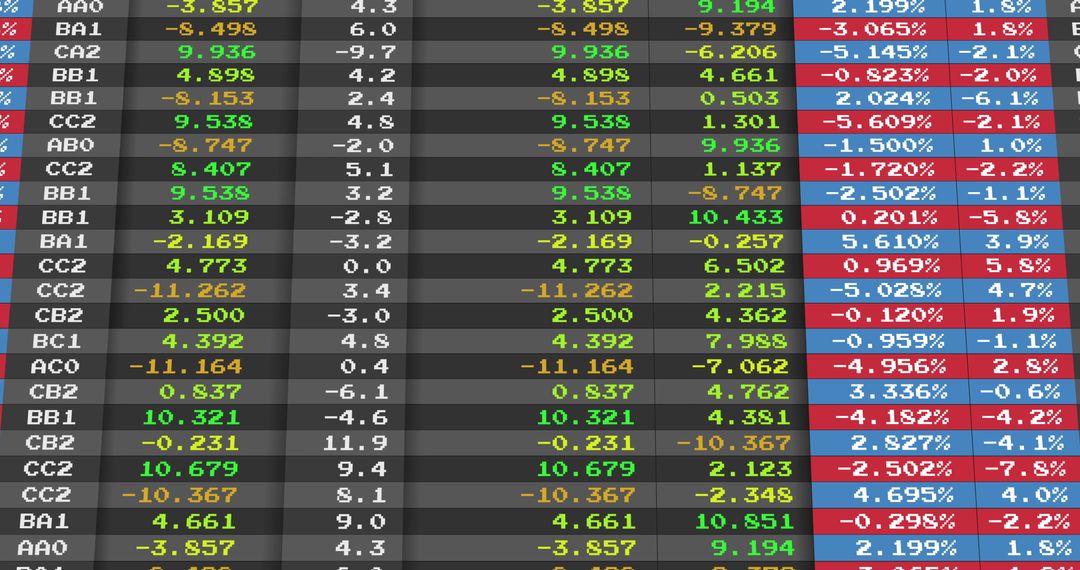
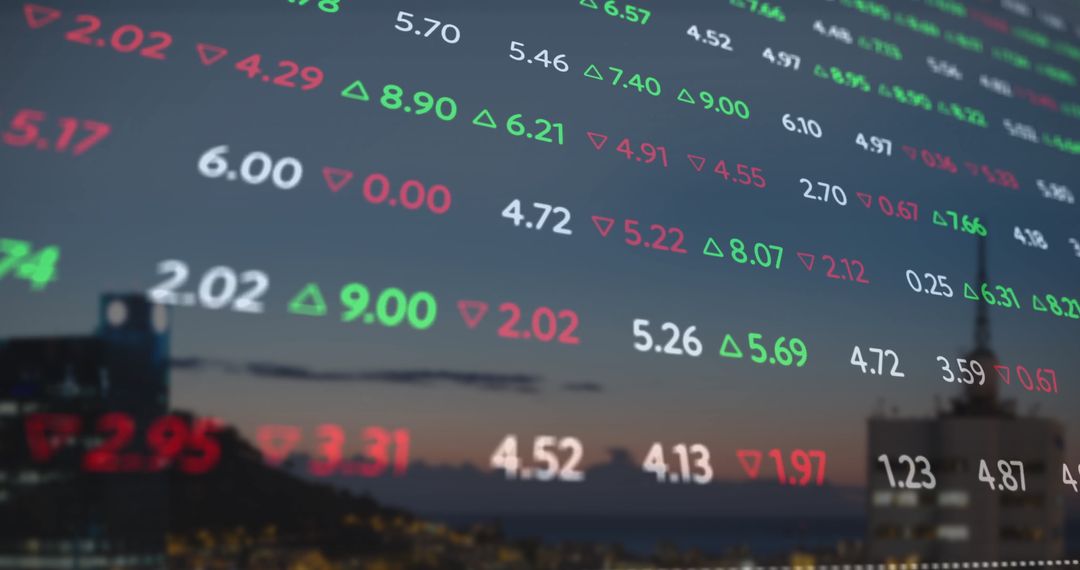
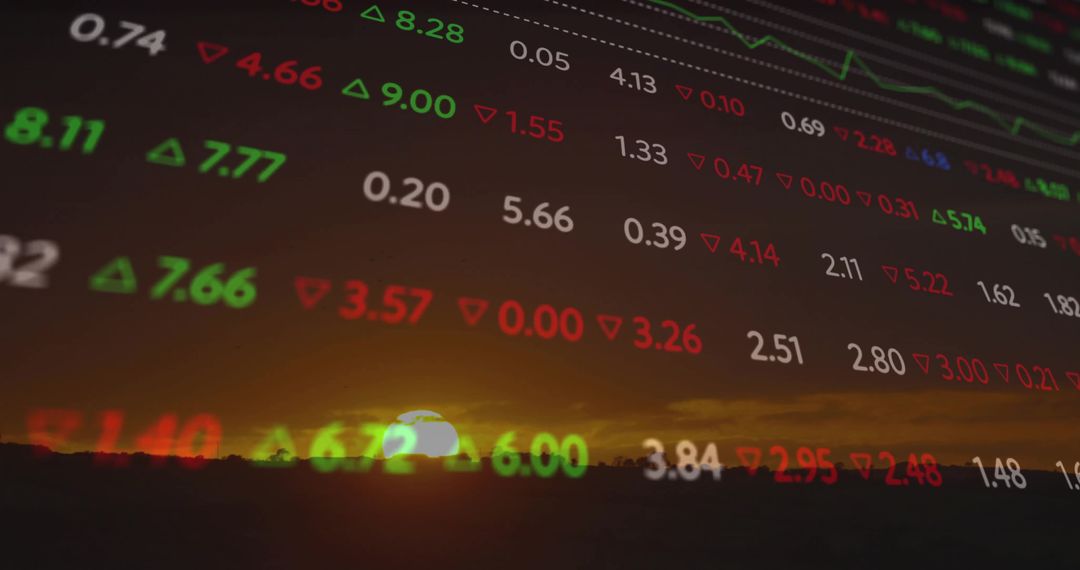
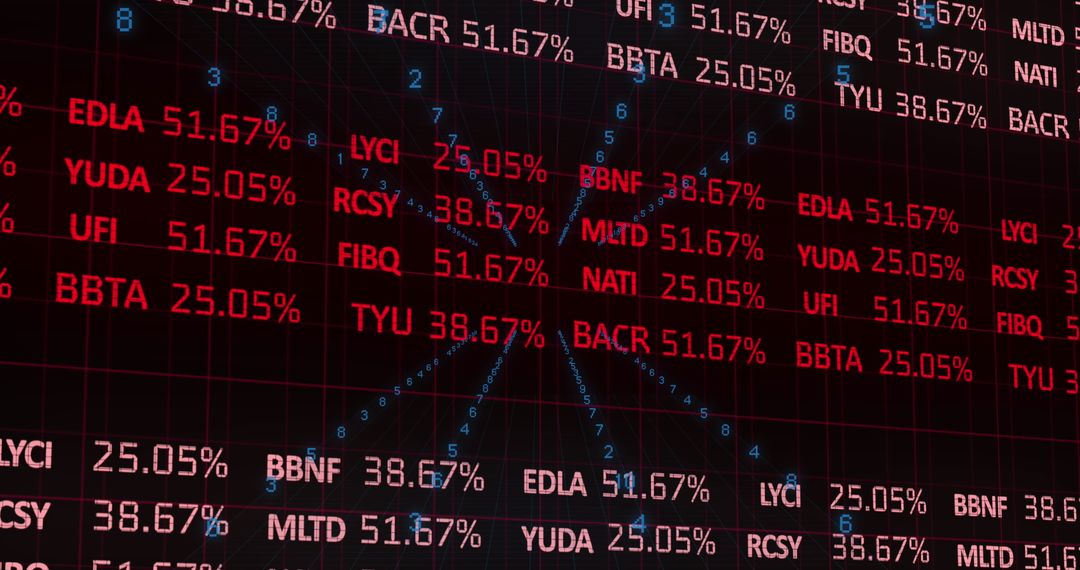
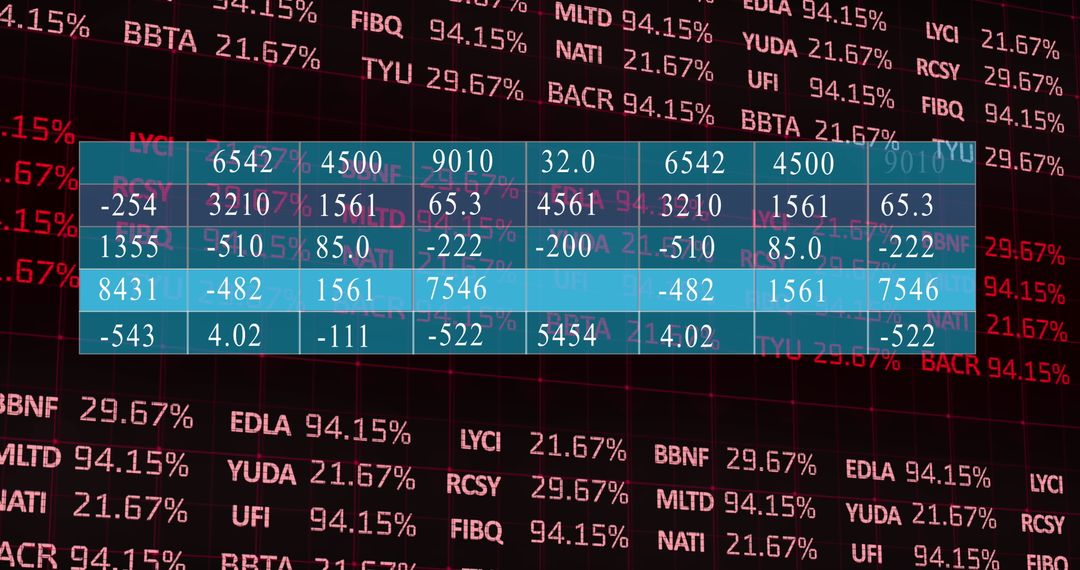
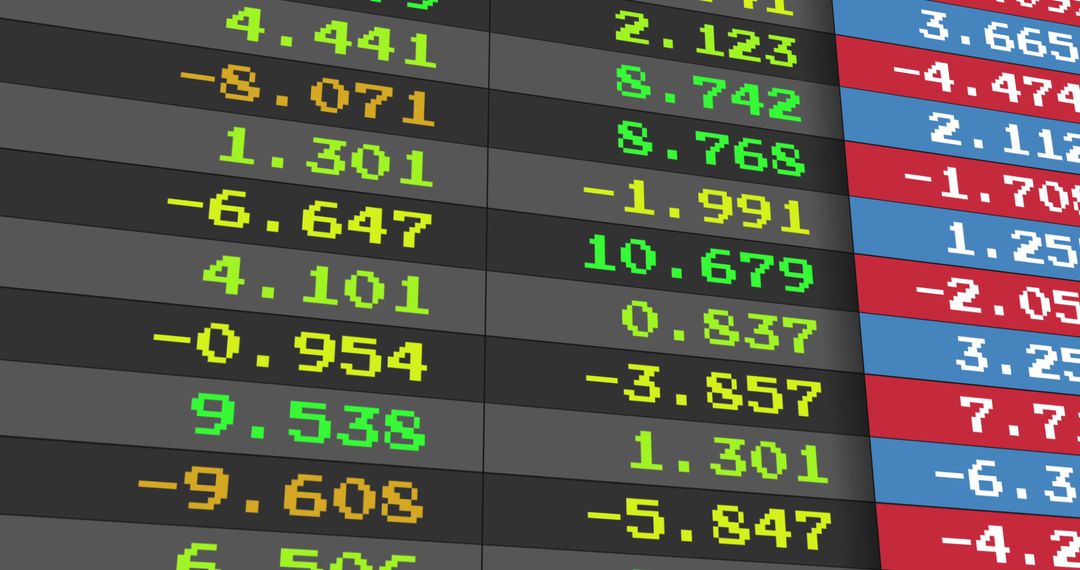
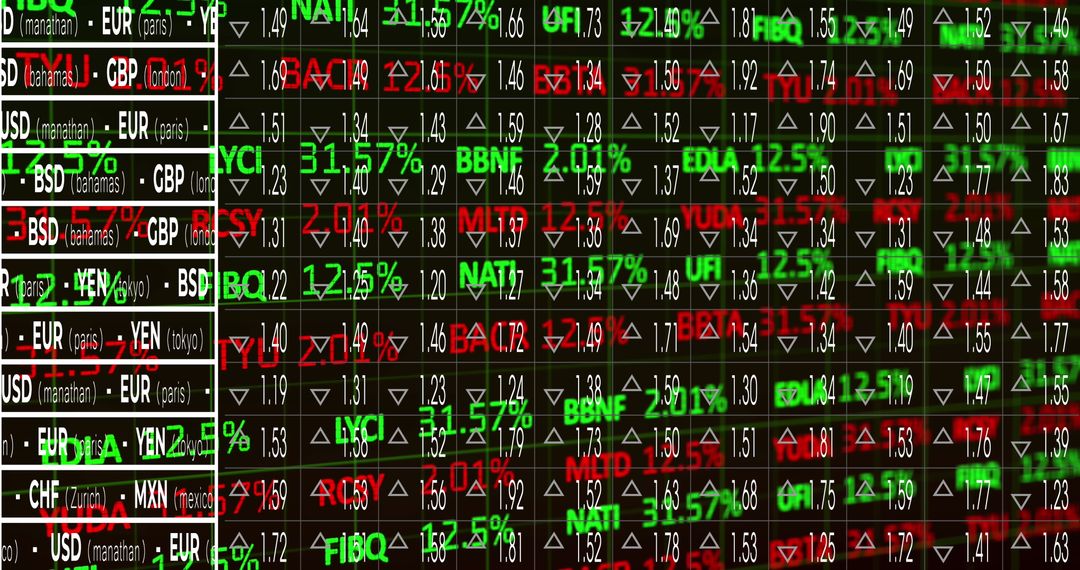
- Comprehensive Financial Dashboard Showing Market Data with Visual Analytics
Comprehensive Financial Dashboard Showing Market Data with Visual Analytics Image

Display involves a combination of vibrant colors and detailed market information, helpful in financial analysis and reporting. Useful for presentations on market trends, professional publications, or applications focused on stock market tracking. Important tool for showcasing financial literacy and technological advancement in investment opportunities.
Powered by 


0
downloads
downloads
Tags:
More
Credit Photo
If you would like to credit the Photo, here are some ways you can do so
Text Link
photo Link
<span class="text-link">
<span>
<a target="_blank" href=https://pikwizard.com/photo/comprehensive-financial-dashboard-showing-market-data-with-visual-analytics/f8c61d4acf27a3c8d902df22216a23fb/>PikWizard</a>
</span>
</span>
<span class="image-link">
<span
style="margin: 0 0 20px 0; display: inline-block; vertical-align: middle; width: 100%;"
>
<a
target="_blank"
href="https://pikwizard.com/photo/comprehensive-financial-dashboard-showing-market-data-with-visual-analytics/f8c61d4acf27a3c8d902df22216a23fb/"
style="text-decoration: none; font-size: 10px; margin: 0;"
>
<img src="https://pikwizard.com/pw/medium/f8c61d4acf27a3c8d902df22216a23fb.jpg" style="margin: 0; width: 100%;" alt="" />
<p style="font-size: 12px; margin: 0;">PikWizard</p>
</a>
</span>
</span>
Free (free of charge)
Free for personal and commercial use.
Author: Authentic Images
Similar Free Stock Images

Premium


Premium


Premium


Premium


Premium


Premium


Premium


Premium


Premium


Premium


Premium


Premium


Premium


Premium


Premium


Premium


Premium


Premium


Premium


Premium


Premium


Premium


Premium


Premium