- Home >
- Stock Photos >
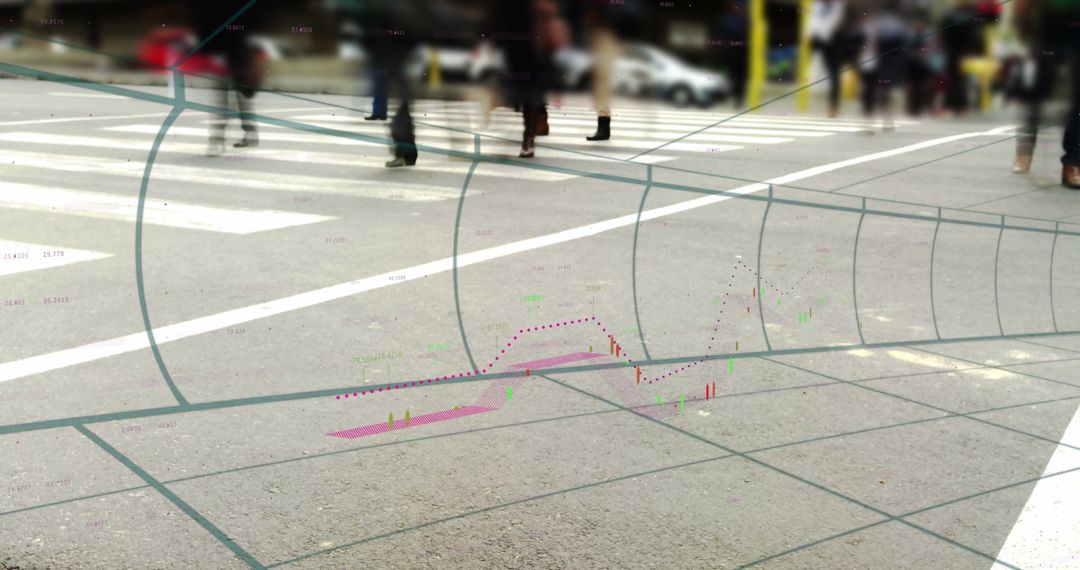
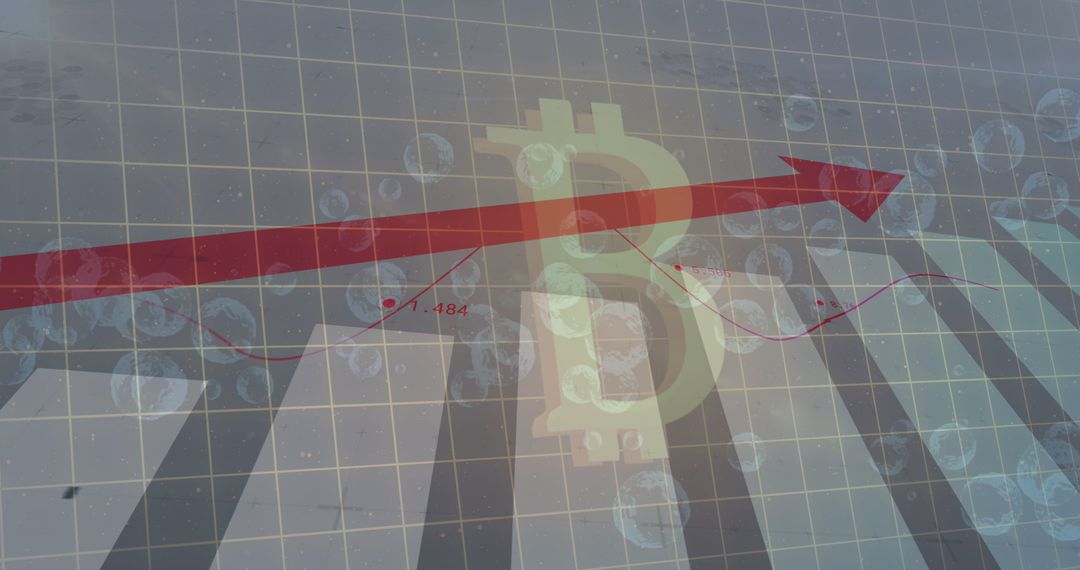
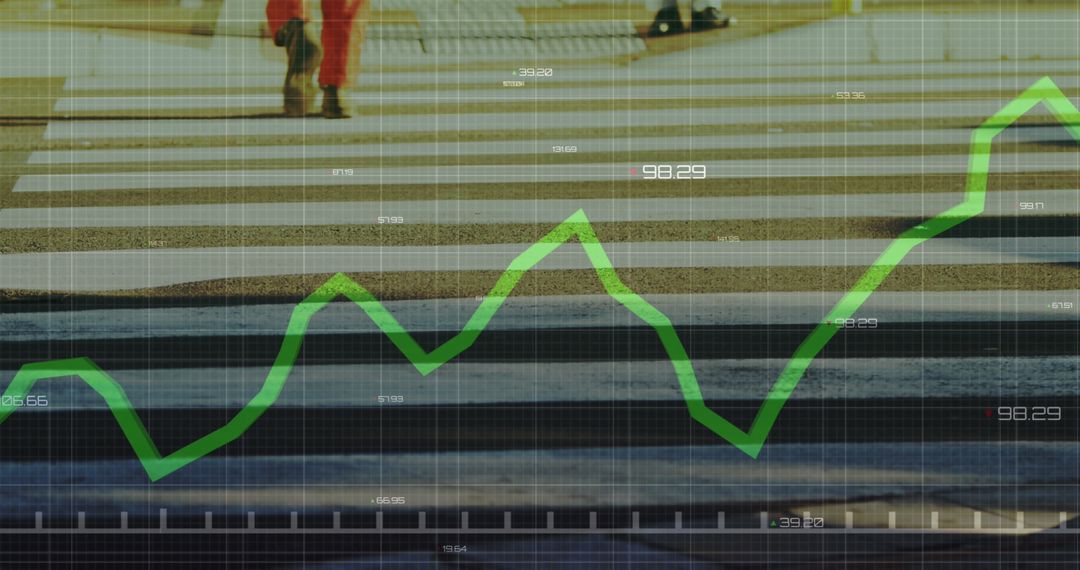
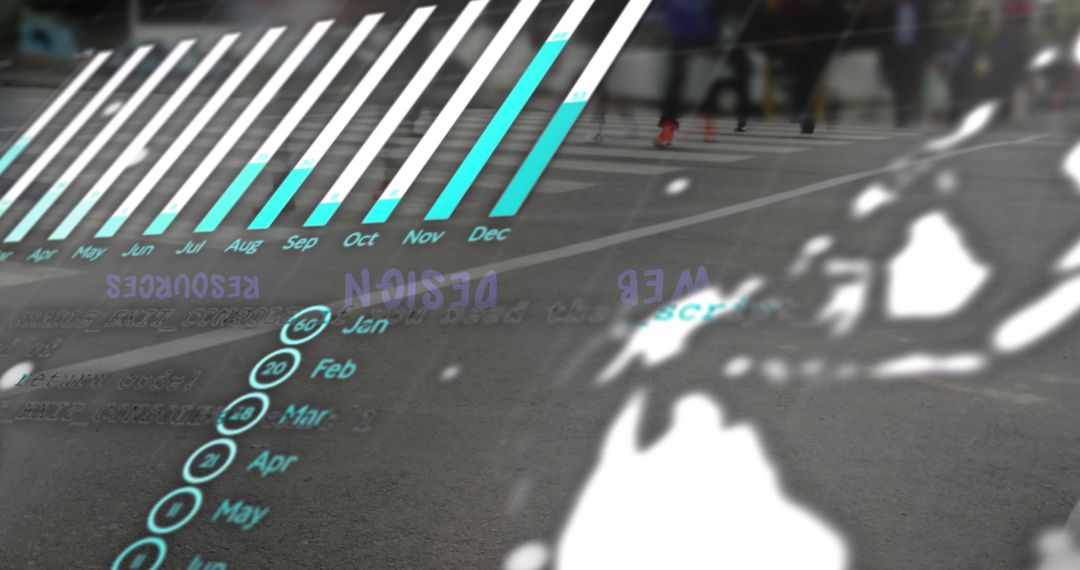
- Conceptual Overlay of Covid-19 Data and People in Motion
Conceptual Overlay of Covid-19 Data and People in Motion Image

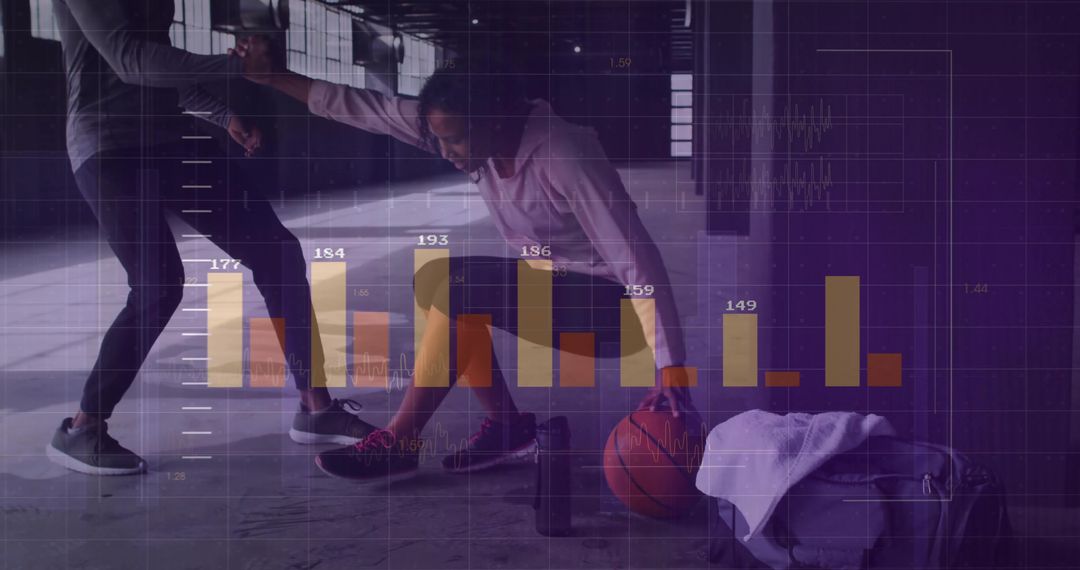
The visual features a transparent overlay of Covid-19 statistical data juxtaposed with people in motion. The dynamic graph trend lines represent changes during the pandemic, symbolizing economic and health repercussions. This illustration can be used in articles discussing the global impact of Covid-19, public health strategies, economic downturns, and studies related to behavioral shifts amid the pandemic.
Powered by  - Get 15% off with code: PIKWIZARD15


2
downloads
downloads
Tags:
More
Credit Photo
If you would like to credit the Photo, here are some ways you can do so
Text Link
photo Link
<span class="text-link">
<span>
<a target="_blank" href=https://pikwizard.com/photo/conceptual-overlay-of-covid-19-data-and-people-in-motion/d53251274db9ae3144ea241a2948b065/>PikWizard</a>
</span>
</span>
<span class="image-link">
<span
style="margin: 0 0 20px 0; display: inline-block; vertical-align: middle; width: 100%;"
>
<a
target="_blank"
href="https://pikwizard.com/photo/conceptual-overlay-of-covid-19-data-and-people-in-motion/d53251274db9ae3144ea241a2948b065/"
style="text-decoration: none; font-size: 10px; margin: 0;"
>
<img src="https://pikwizard.com/pw/medium/d53251274db9ae3144ea241a2948b065.jpg" style="margin: 0; width: 100%;" alt="" />
<p style="font-size: 12px; margin: 0;">PikWizard</p>
</a>
</span>
</span>
Free (free of charge)
Free for personal and commercial use.
Author: Creative Art
Similar Free Stock Images

Premium


Premium


Premium


Premium


Premium


Premium


Premium


Premium


Premium


Premium


Premium


Premium


Premium


Premium


Premium


Premium


Premium


Premium


Premium


Premium


Premium


Premium


Premium


Premium