- Home >
- Stock Photos >
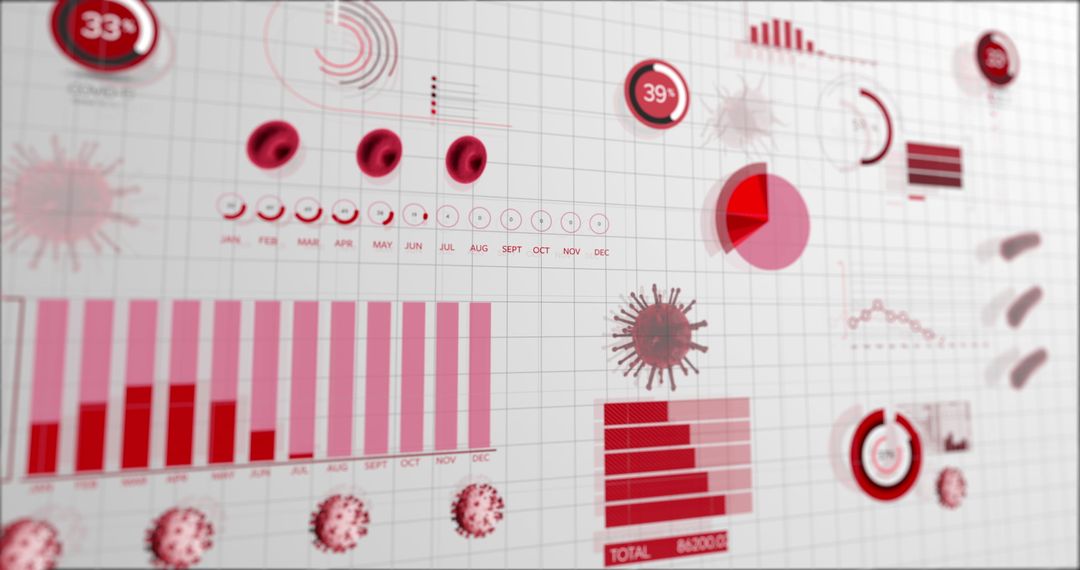
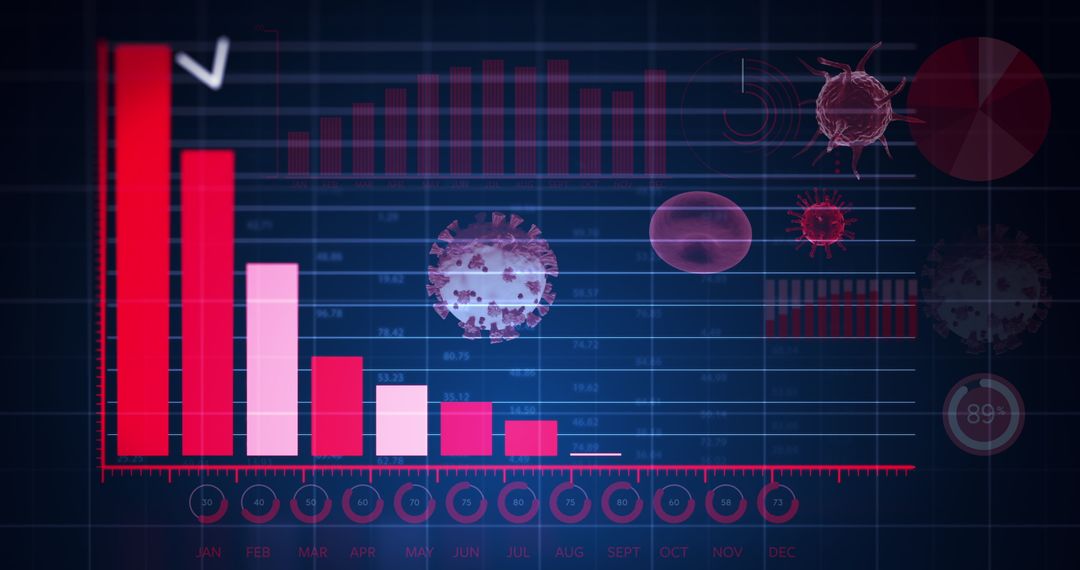
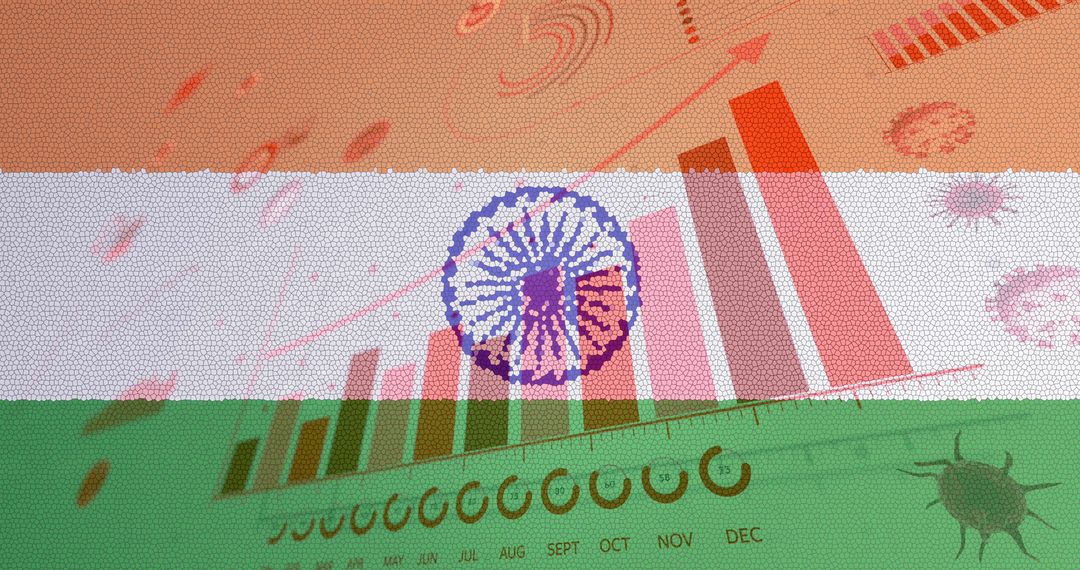
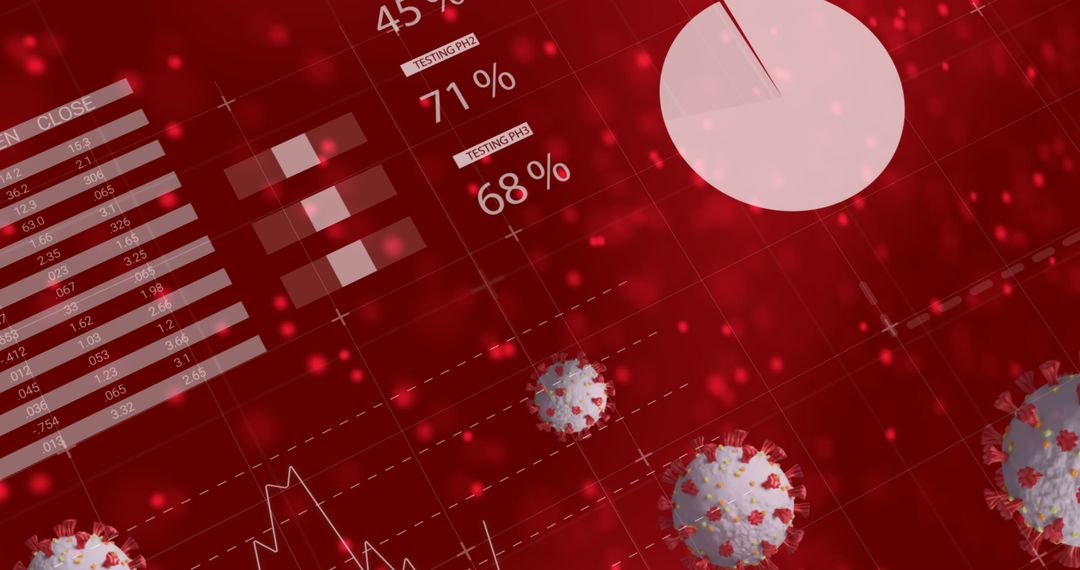
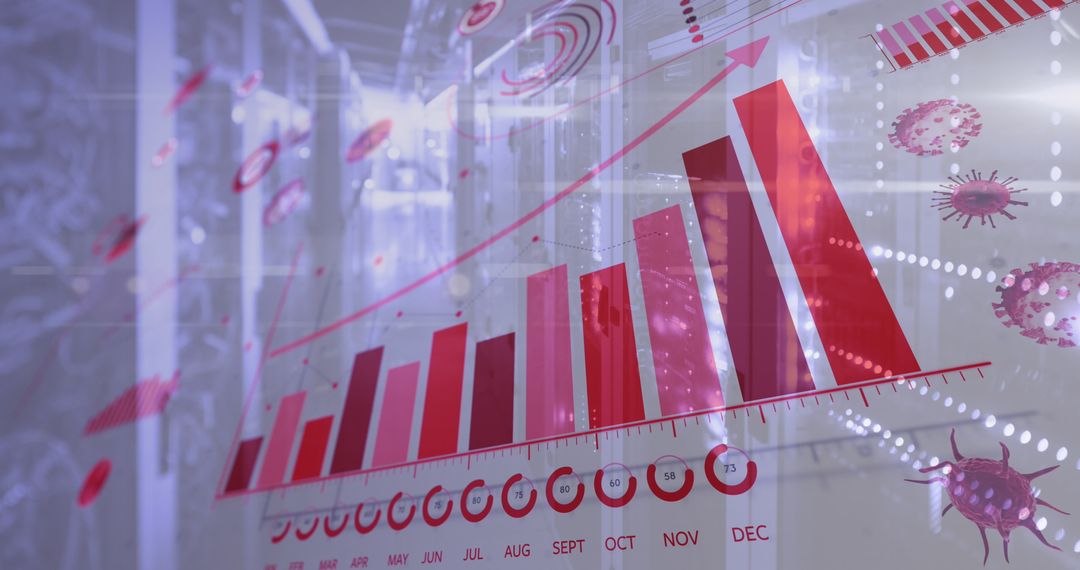
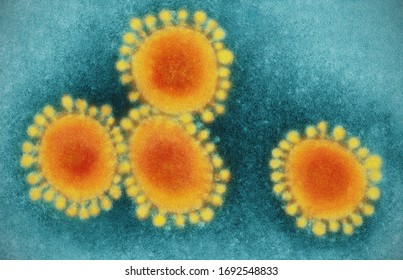
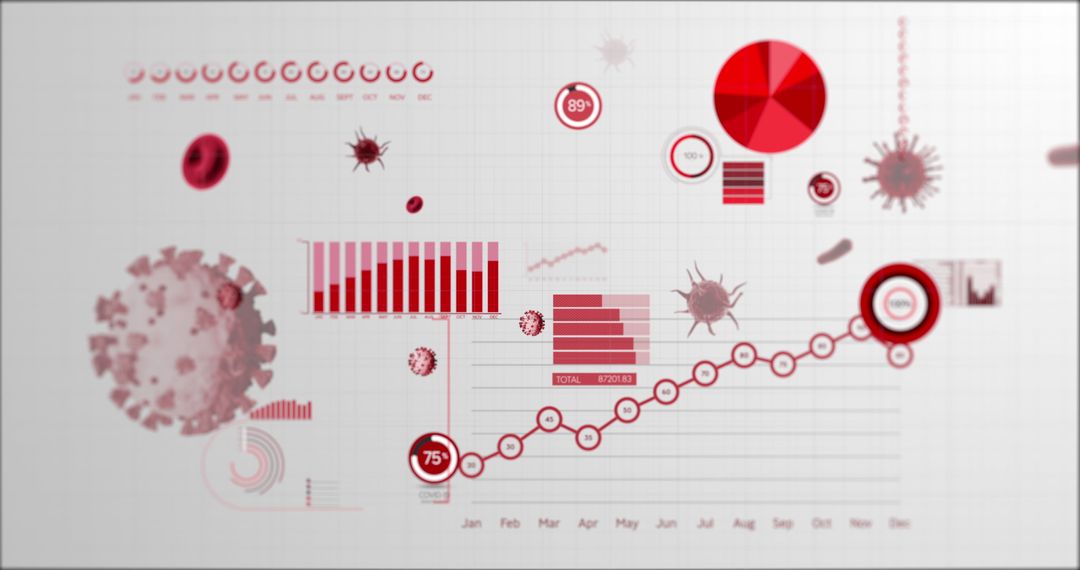
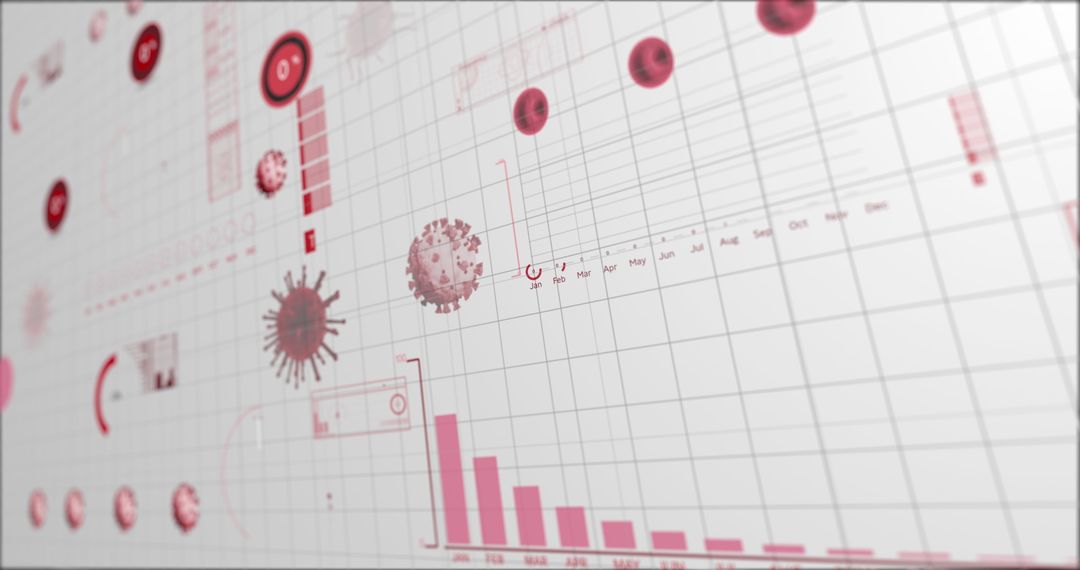
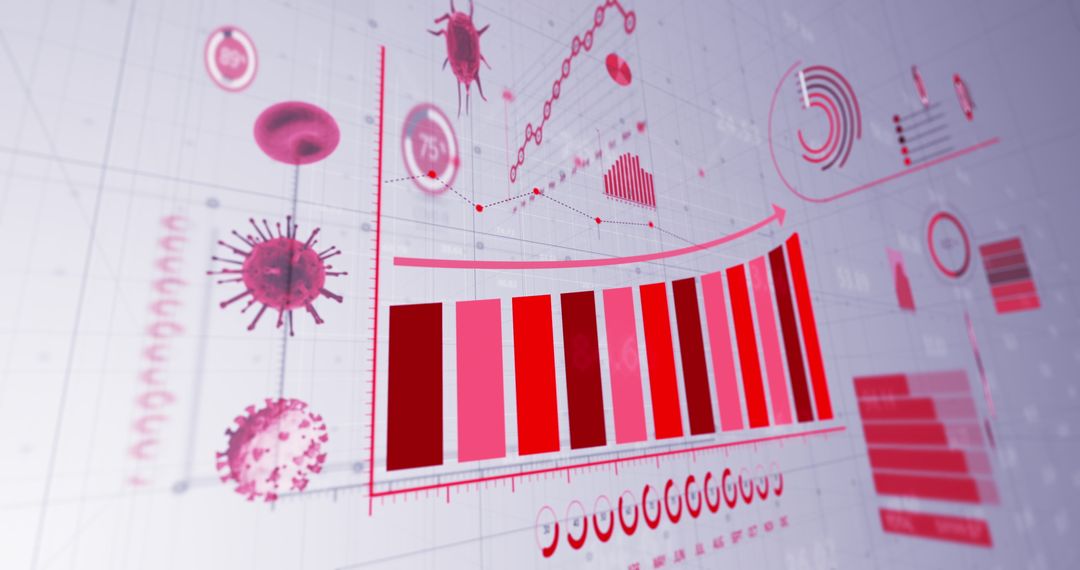
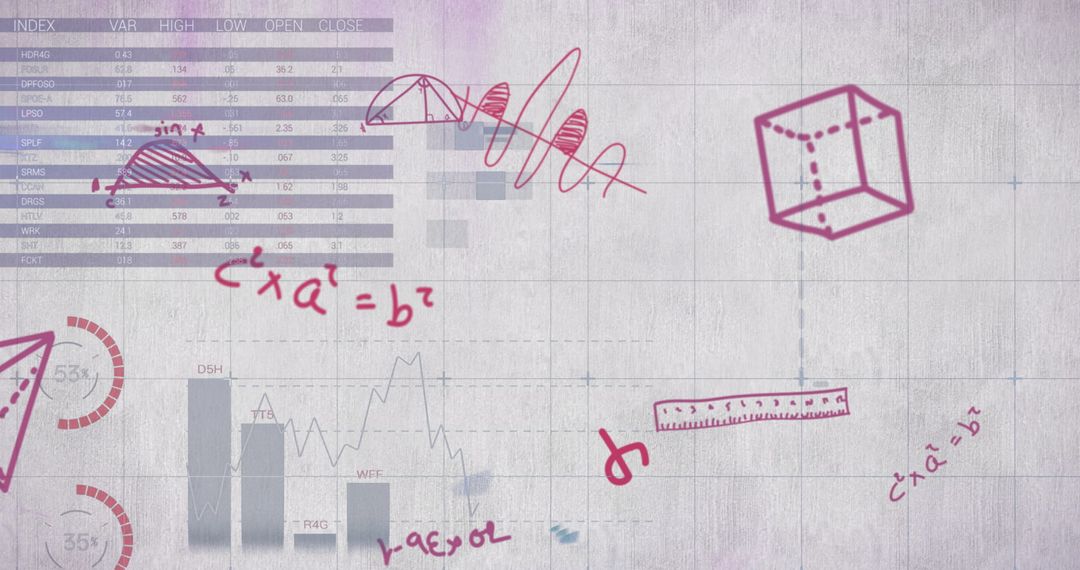
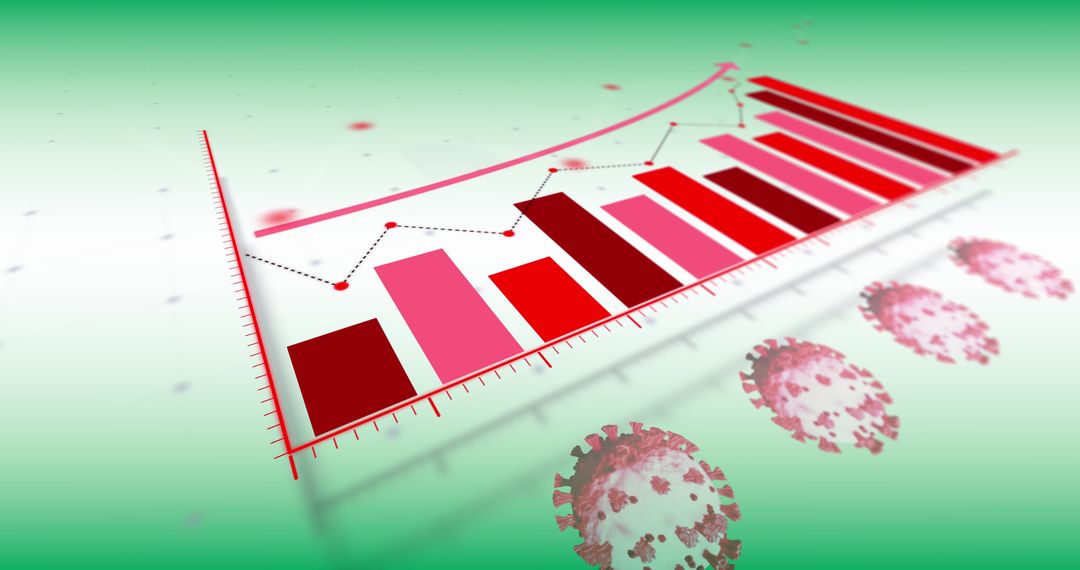
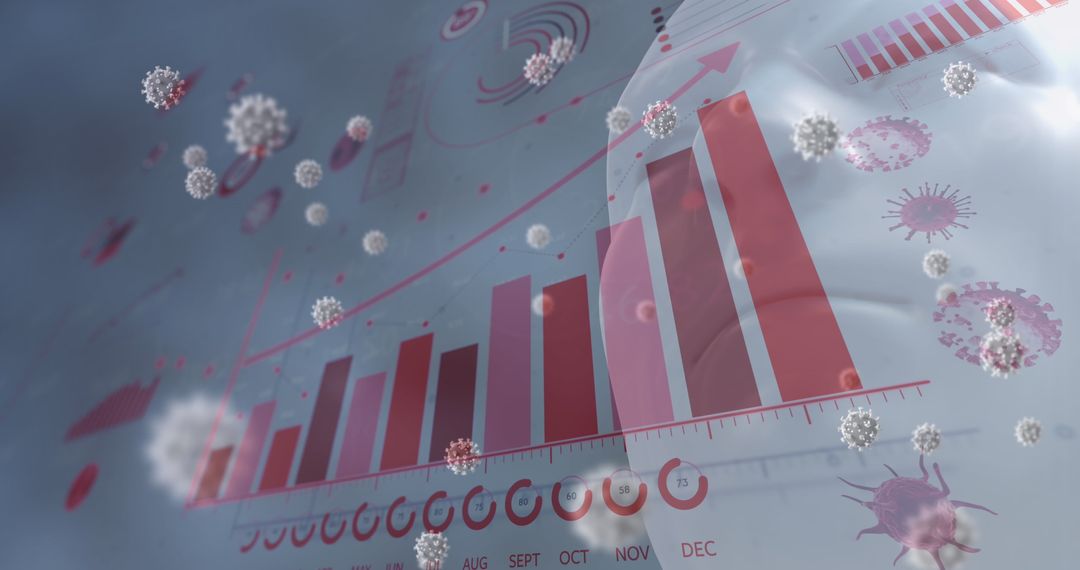
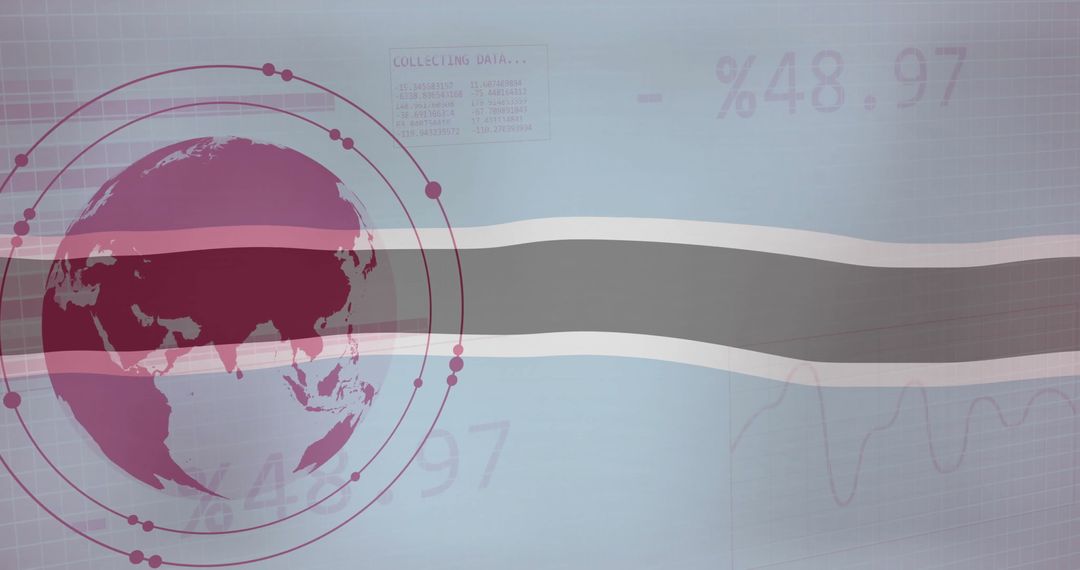
- Covid-19 Data Analytics with Virus Cells and Graphs
Covid-19 Data Analytics with Virus Cells and Graphs Image

Visualizing impact of Covid-19 using digital data and bar graphs, focusing on virus cell imagery. Useful for presentations on pandemic analysis, public health studies, statistical reporting, and data science projects relating to infectious disease tracking.
Powered by  - Get 15% off with code: PIKWIZARD15


2
downloads
downloads
Tags:
More
Credit Photo
If you would like to credit the Photo, here are some ways you can do so
Text Link
photo Link
<span class="text-link">
<span>
<a target="_blank" href=https://pikwizard.com/photo/covid-19-data-analytics-with-virus-cells-and-graphs/c474808fc18fea20b16412e0b264b3c4/>PikWizard</a>
</span>
</span>
<span class="image-link">
<span
style="margin: 0 0 20px 0; display: inline-block; vertical-align: middle; width: 100%;"
>
<a
target="_blank"
href="https://pikwizard.com/photo/covid-19-data-analytics-with-virus-cells-and-graphs/c474808fc18fea20b16412e0b264b3c4/"
style="text-decoration: none; font-size: 10px; margin: 0;"
>
<img src="https://pikwizard.com/pw/medium/c474808fc18fea20b16412e0b264b3c4.jpg" style="margin: 0; width: 100%;" alt="" />
<p style="font-size: 12px; margin: 0;">PikWizard</p>
</a>
</span>
</span>
Free (free of charge)
Free for personal and commercial use.
Author: Awesome Content
Similar Free Stock Images
Premium


Premium


Premium


Premium


Premium


Premium


Premium


Premium


Premium


Premium


Premium


Premium


Premium


Premium


Premium


Premium


Premium


Premium


Premium


Premium


Premium


Premium


Premium


Premium