- Home >
- Stock Photos >
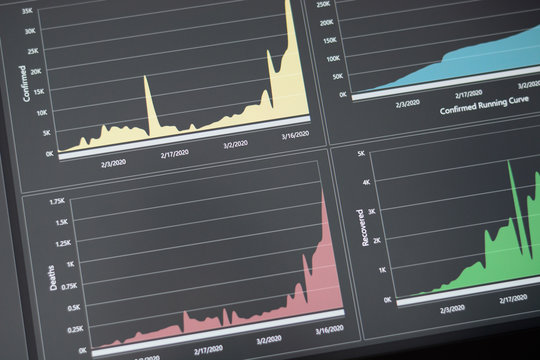
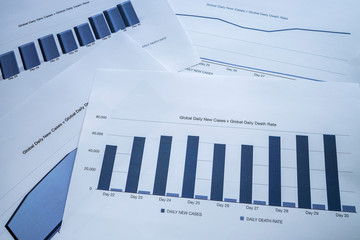
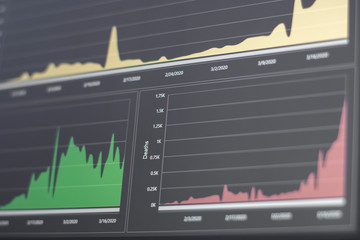
- Covid-19 Data Visualization with Growth Chart and Virus Cells
Covid-19 Data Visualization with Growth Chart and Virus Cells Image

This graphic illustrates the rise in Covid-19 data metrics, featuring bar charts and decorative virus cell icons. Useful for articles on pandemic trends, research papers, statistical analyses, or presentations focusing on Covid-19's impact and data tracking.
Powered by 


2
downloads
downloads
Tags:
More
Credit Photo
If you would like to credit the Photo, here are some ways you can do so
Text Link
photo Link
<span class="text-link">
<span>
<a target="_blank" href=https://pikwizard.com/photo/covid-19-data-visualization-with-growth-chart-and-virus-cells/84fc61676aa02951a7938dad465e2326/>PikWizard</a>
</span>
</span>
<span class="image-link">
<span
style="margin: 0 0 20px 0; display: inline-block; vertical-align: middle; width: 100%;"
>
<a
target="_blank"
href="https://pikwizard.com/photo/covid-19-data-visualization-with-growth-chart-and-virus-cells/84fc61676aa02951a7938dad465e2326/"
style="text-decoration: none; font-size: 10px; margin: 0;"
>
<img src="https://pikwizard.com/pw/medium/84fc61676aa02951a7938dad465e2326.jpg" style="margin: 0; width: 100%;" alt="" />
<p style="font-size: 12px; margin: 0;">PikWizard</p>
</a>
</span>
</span>
Free (free of charge)
Free for personal and commercial use.
Author: Authentic Images
Similar Free Stock Images

Premium


Premium


Premium


Premium


Premium


Premium


Premium


Premium


Premium


Premium


Premium


Premium


Premium


Premium


Premium


Premium


Premium


Premium


Premium


Premium


Premium


Premium


Premium


Premium


Premium