- Home >
- Stock Photos >
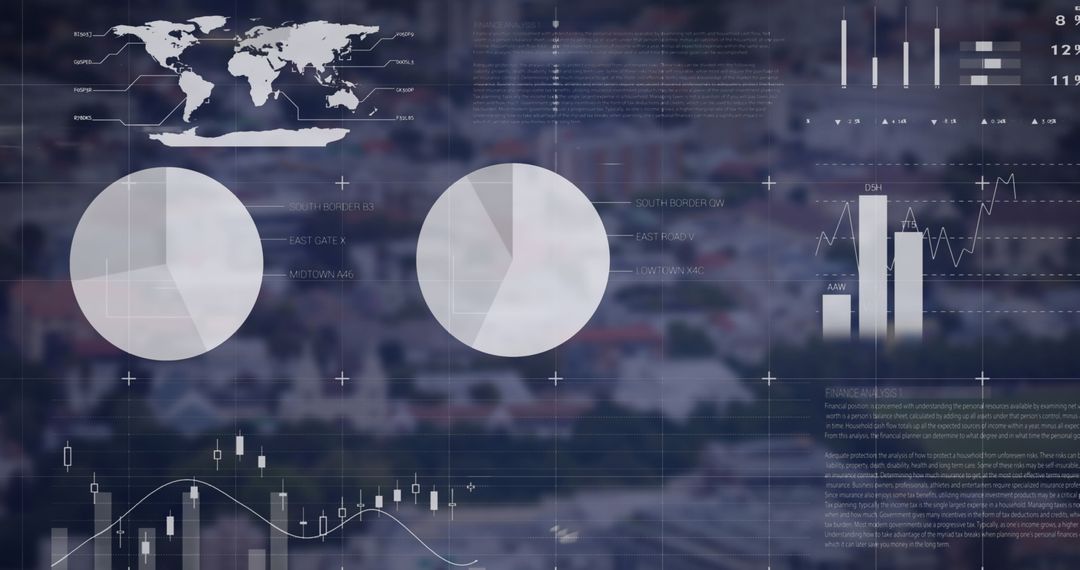
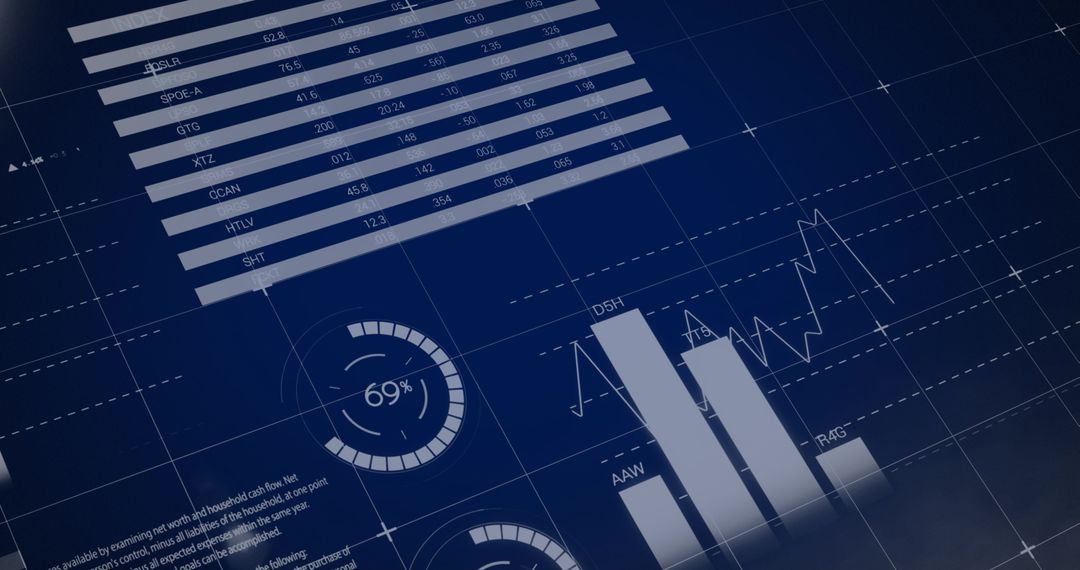
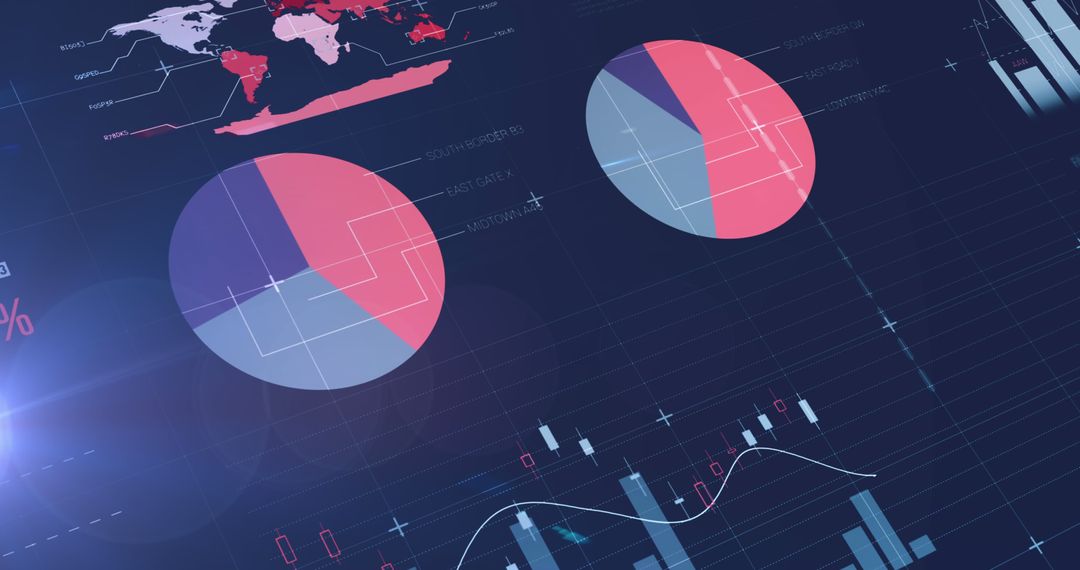
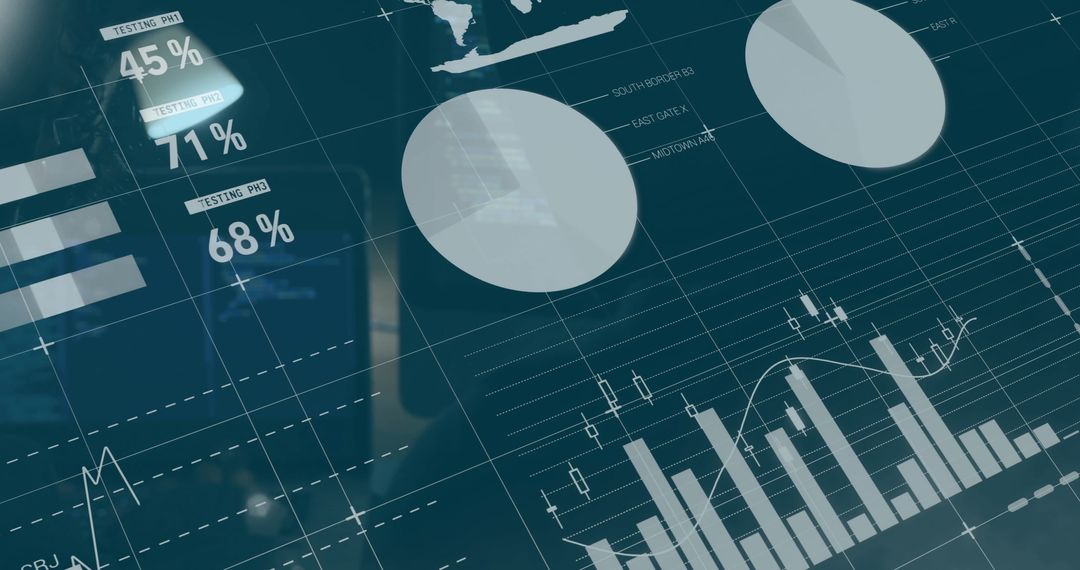
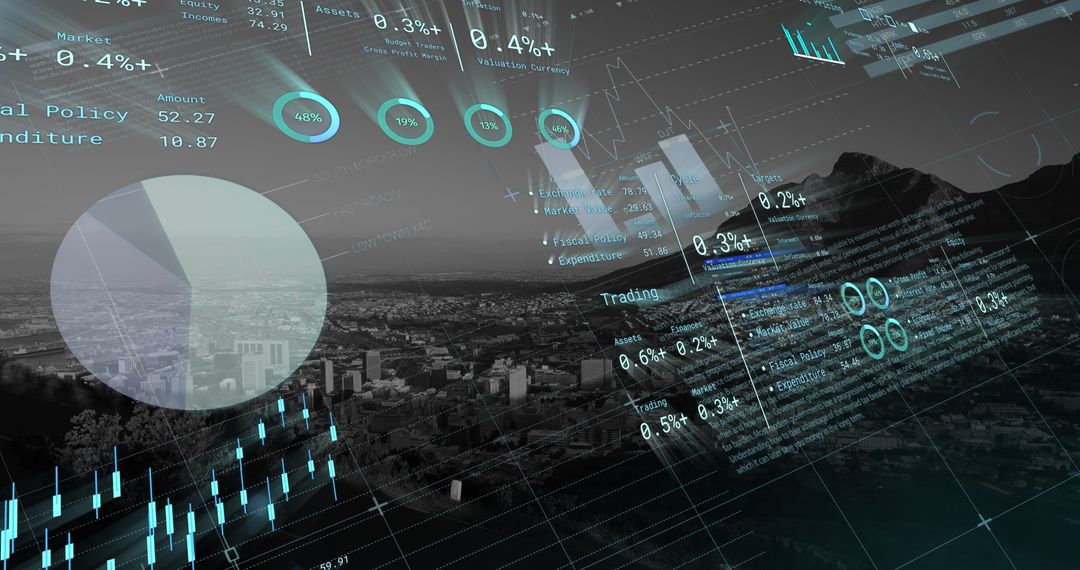
- Dark Blue Financial Dashboard with Large Pale Pie Chart and Candlestick Graphs
Dark Blue Financial Dashboard with Large Pale Pie Chart and Candlestick Graphs Image

Showing large pale pie chart alongside vertical bar graphs and candlestick charts over dark-blue gridlines, conveying data analytics and market insights. Ideal for fintech presentations, investor reports, business intelligence dashboards, and corporate websites. Helping visualize complex metrics, trends, regional comparisons, and performance indicators for annual reports, pitch decks, marketing campaigns, and social posts. Featuring modern interface aesthetic and subtle lens flare, suiting branding, editorial layouts, training materials, and technology product pages.
Powered by  - Get 15% off with code: PIKWIZARD15


0
downloads
downloads
Tags:
More
Credit Photo
If you would like to credit the Photo, here are some ways you can do so
Text Link
photo Link
<span class="text-link">
<span>
<a target="_blank" href=https://pikwizard.com/photo/dark-blue-financial-dashboard-with-large-pale-pie-chart-and-candlestick-graphs/39966c387f4345e608387cb91de999c0/>PikWizard</a>
</span>
</span>
<span class="image-link">
<span
style="margin: 0 0 20px 0; display: inline-block; vertical-align: middle; width: 100%;"
>
<a
target="_blank"
href="https://pikwizard.com/photo/dark-blue-financial-dashboard-with-large-pale-pie-chart-and-candlestick-graphs/39966c387f4345e608387cb91de999c0/"
style="text-decoration: none; font-size: 10px; margin: 0;"
>
<img src="https://pikwizard.com/pw/medium/39966c387f4345e608387cb91de999c0.jpg" style="margin: 0; width: 100%;" alt="" />
<p style="font-size: 12px; margin: 0;">PikWizard</p>
</a>
</span>
</span>
Free (free of charge)
Free for personal and commercial use.
Author: Creative Art
Similar Free Stock Images

Premium


Premium


Premium


Premium


Premium


Premium


Premium


Premium


Premium

Premium


Premium


Premium


Premium


Premium


Premium


Premium


Premium


Premium


Premium


Premium


Premium


Premium


Premium


Premium