- Home >
- Stock Photos >
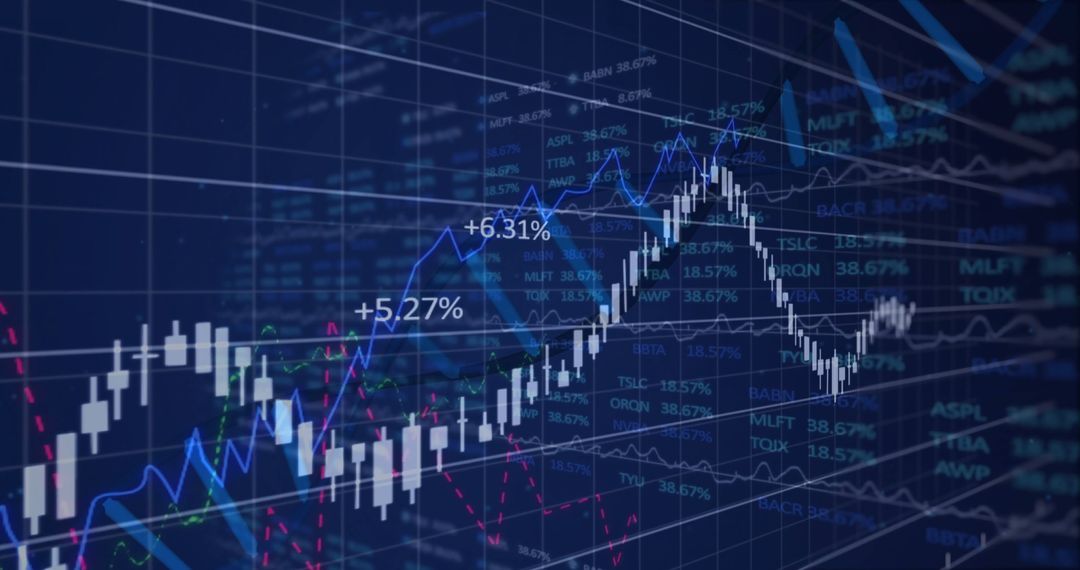
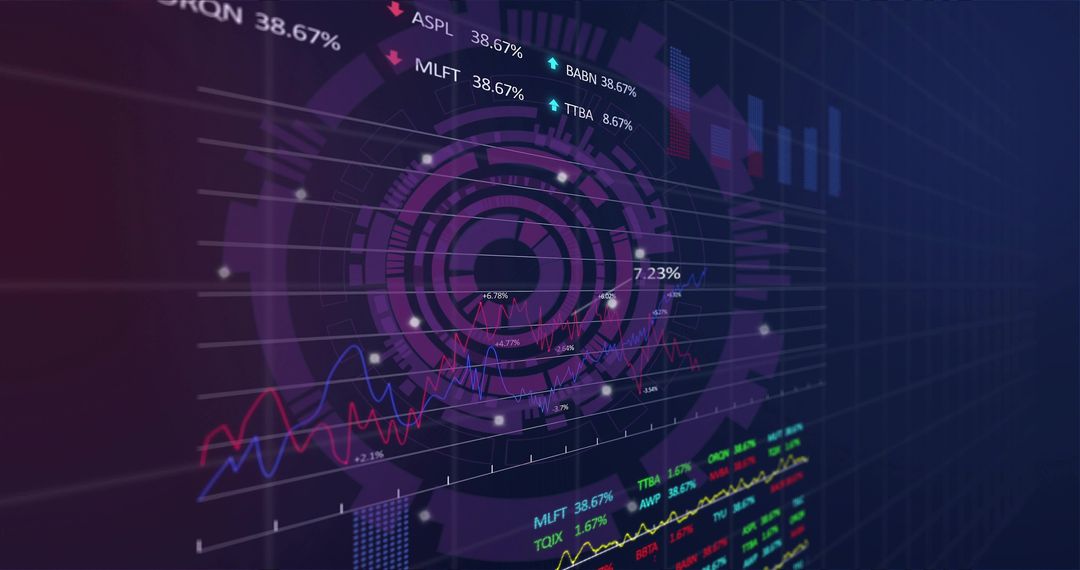
- Dark Financial Dashboard Displaying Live Market Charts with 7.23% Callout
Dark Financial Dashboard Displaying Live Market Charts with 7.23% Callout Image

Showing dark blue financial dashboard with tilted grid, red/blue/yellow line charts, bar chart snippets and percentage callouts. Close-up highlighting 7.23% annotation and multiple tickers with up/down indicators. Composition using diagonal perspective and layered HUD elements creating depth and dynamic motion. Color palette using deep navy background with neon accents for modern tech look. Useful for fintech website hero banners, investor presentation slides, financial report covers, trading app mockups, analytics platform marketing, or video background for business news. Editable for overlaying headlines, logos, or data labels. Ideal for illustrating market volatility, growth trends, performance metrics, real-time analytics, or data-driven storytelling.
Powered by  - Get 15% off with code: PIKWIZARD15


0
downloads
downloads
Tags:
More
Credit Photo
If you would like to credit the Photo, here are some ways you can do so
Text Link
photo Link
<span class="text-link">
<span>
<a target="_blank" href=https://pikwizard.com/photo/dark-financial-dashboard-displaying-live-market-charts-with-7-23-percent-callout/498d4f90f5f7be5128e6f520af562184/>PikWizard</a>
</span>
</span>
<span class="image-link">
<span
style="margin: 0 0 20px 0; display: inline-block; vertical-align: middle; width: 100%;"
>
<a
target="_blank"
href="https://pikwizard.com/photo/dark-financial-dashboard-displaying-live-market-charts-with-7-23-percent-callout/498d4f90f5f7be5128e6f520af562184/"
style="text-decoration: none; font-size: 10px; margin: 0;"
>
<img src="https://pikwizard.com/pw/medium/498d4f90f5f7be5128e6f520af562184.jpg" style="margin: 0; width: 100%;" alt="" />
<p style="font-size: 12px; margin: 0;">PikWizard</p>
</a>
</span>
</span>
Free (free of charge)
Free for personal and commercial use.
Author: Authentic Images
Similar Free Stock Images

Premium


Premium


Premium


Premium


Premium


Premium


Premium


Premium


Premium


Premium


Premium


Premium


Premium


Premium


Premium


Premium


Premium


Premium


Premium


Premium


Premium


Premium


Premium


Premium