- Home >
- Stock Photos >
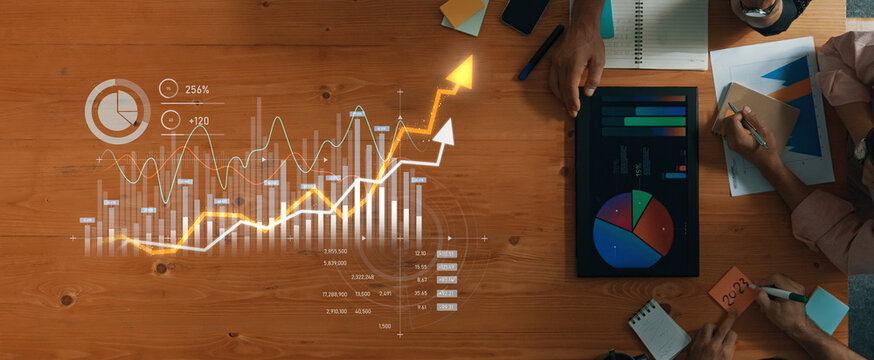
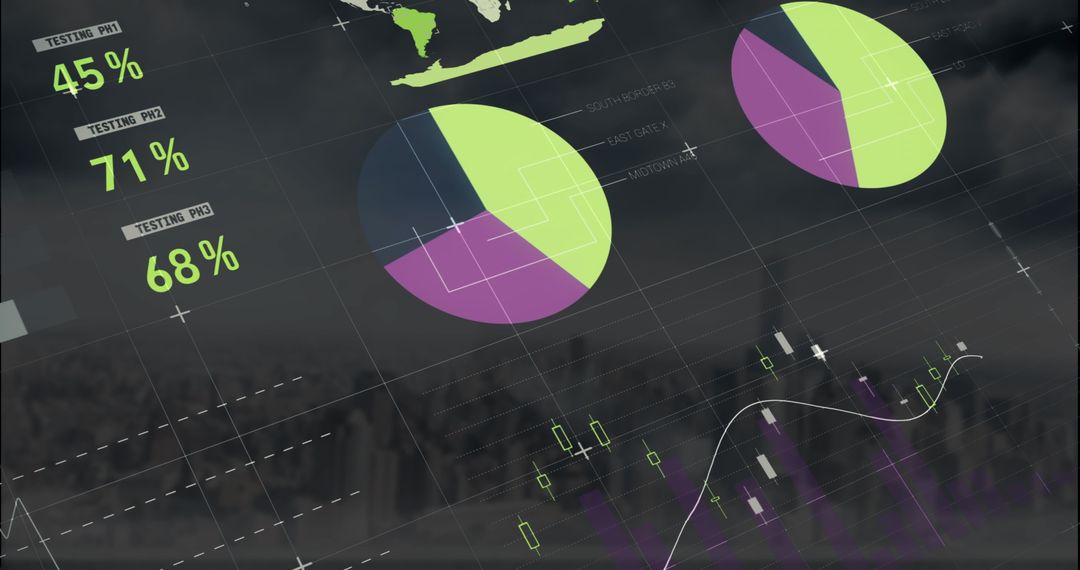
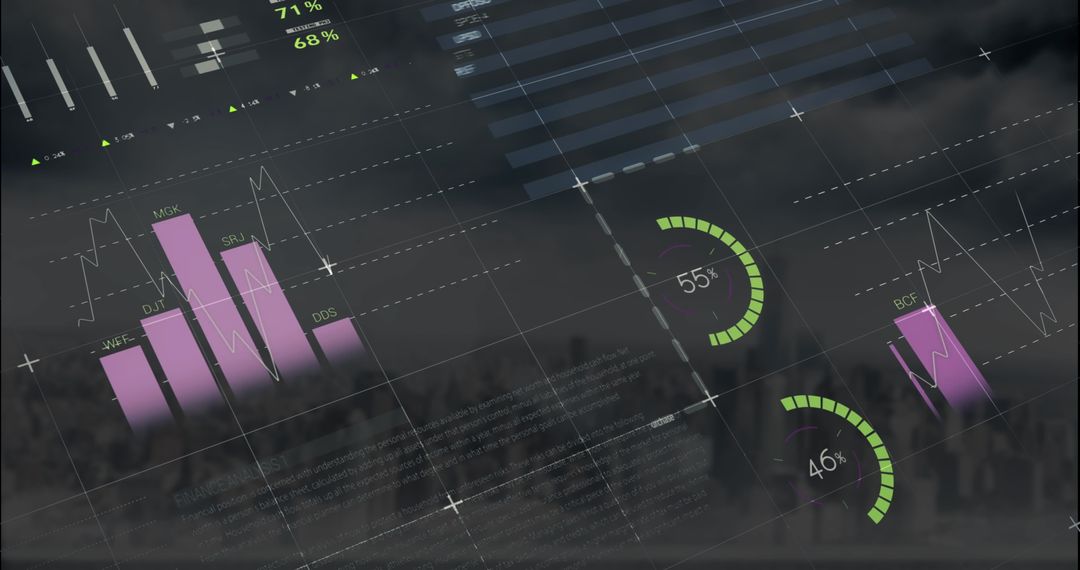
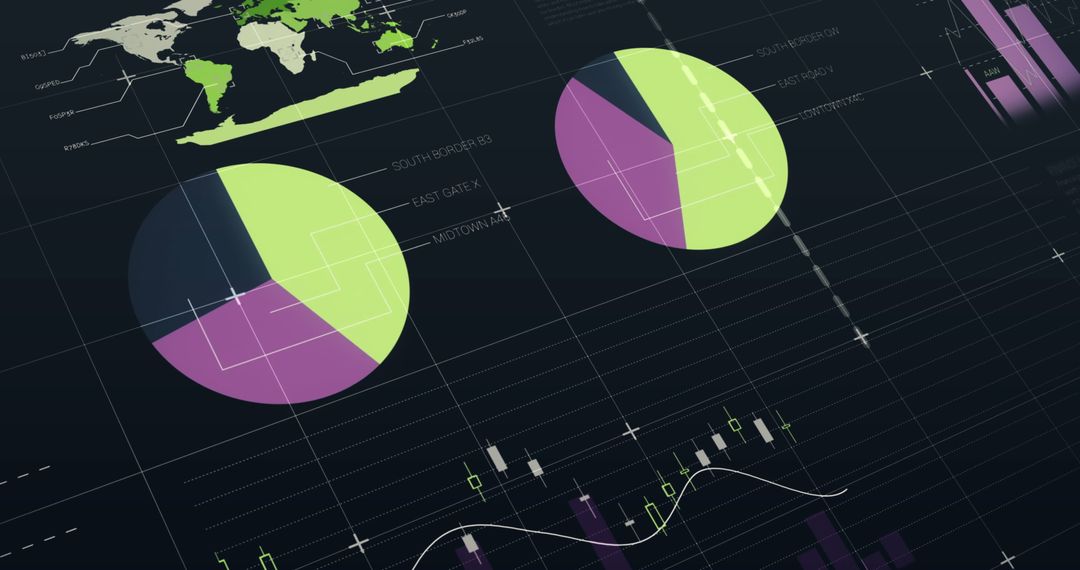
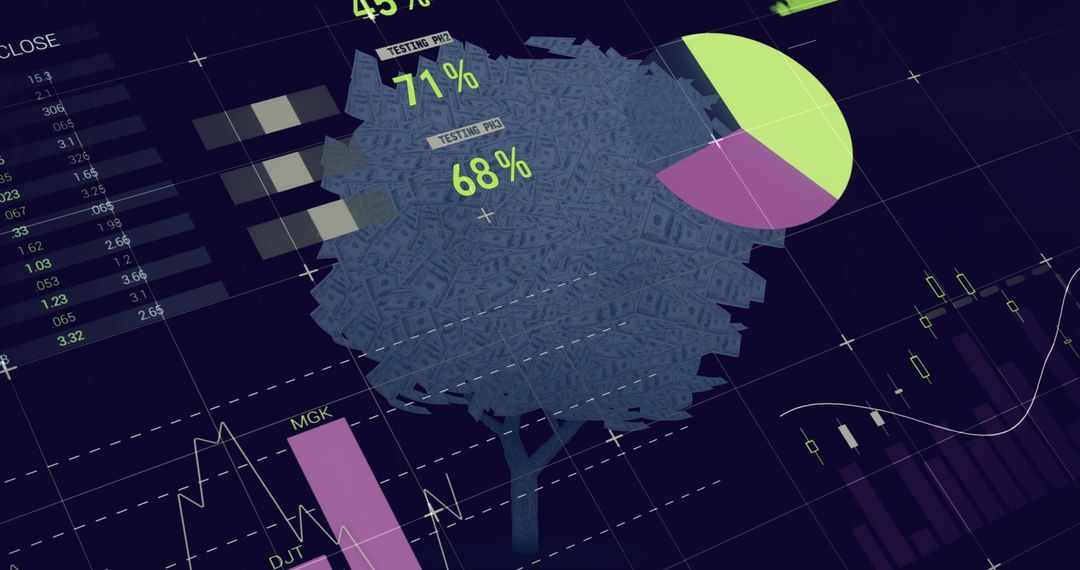
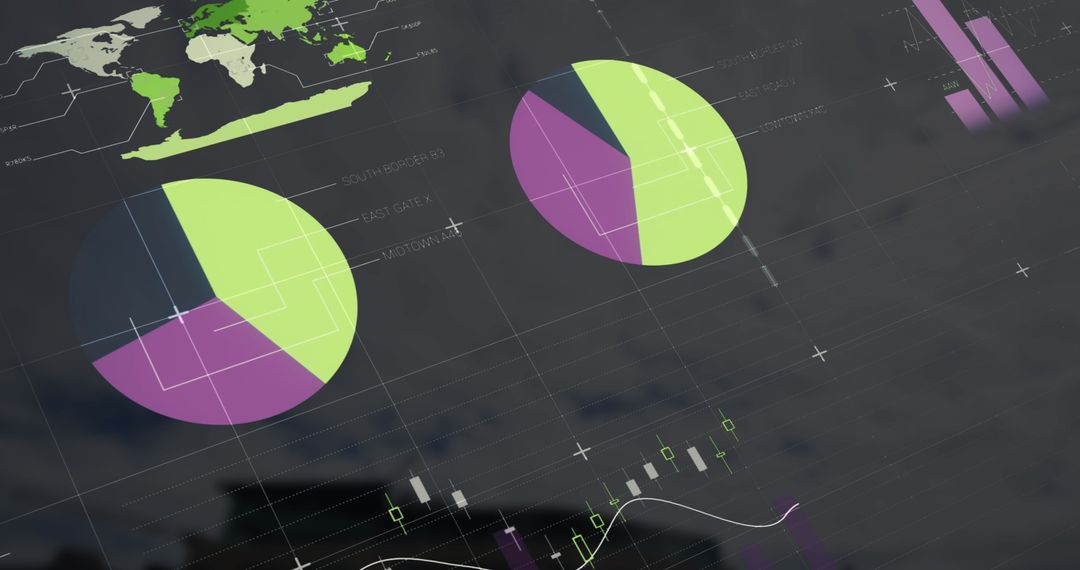
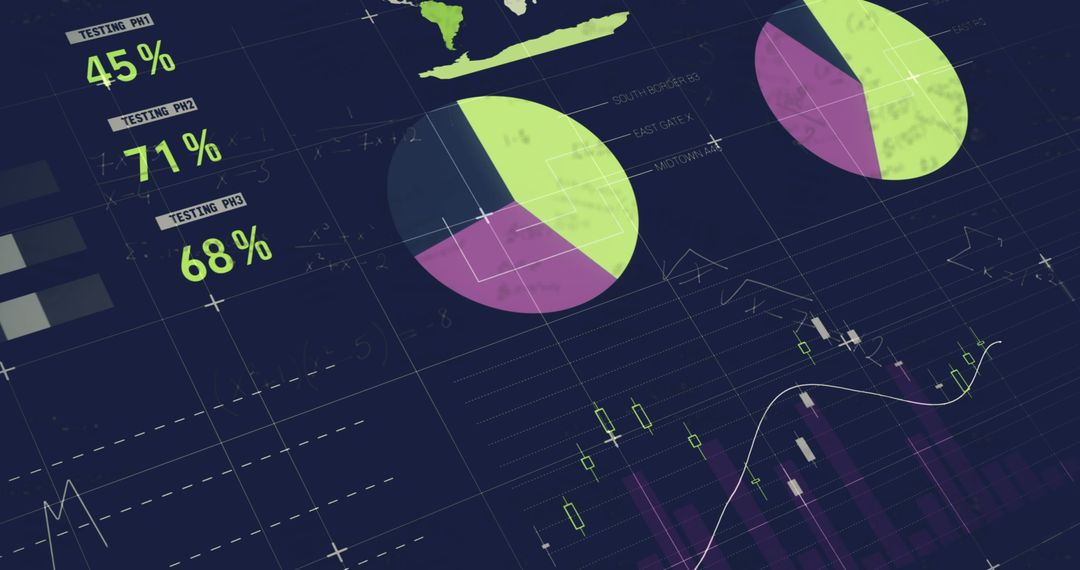
- Data Analysis Concept with Pie Charts on Office Desk
Data Analysis Concept with Pie Charts on Office Desk Image

Graphical overlays of pie charts and digital diagrams appear on an office desk background with a world map. Utilized for illustrating data analysis, business presentations, technology themes, and marketing strategies. An ideal resource for businesses, educational materials, or illustrating economic data concepts.
Powered by 


2
downloads
downloads
Tags:
More
Credit Photo
If you would like to credit the Photo, here are some ways you can do so
Text Link
photo Link
<span class="text-link">
<span>
<a target="_blank" href=https://pikwizard.com/photo/data-analysis-concept-with-pie-charts-on-office-desk/f03b68e214f24cc79164c0f4bc2f5309/>PikWizard</a>
</span>
</span>
<span class="image-link">
<span
style="margin: 0 0 20px 0; display: inline-block; vertical-align: middle; width: 100%;"
>
<a
target="_blank"
href="https://pikwizard.com/photo/data-analysis-concept-with-pie-charts-on-office-desk/f03b68e214f24cc79164c0f4bc2f5309/"
style="text-decoration: none; font-size: 10px; margin: 0;"
>
<img src="https://pikwizard.com/pw/medium/f03b68e214f24cc79164c0f4bc2f5309.jpg" style="margin: 0; width: 100%;" alt="" />
<p style="font-size: 12px; margin: 0;">PikWizard</p>
</a>
</span>
</span>
Free (free of charge)
Free for personal and commercial use.
Author: Awesome Content
Similar Free Stock Images
Premium


Premium


Premium


Premium


Premium


Premium


Premium


Premium


Premium


Premium


Premium


Premium


Premium


Premium


Premium


Premium


Premium


Premium


Premium


Premium


Premium


Premium


Premium


Premium