- Home >
- Stock Photos >
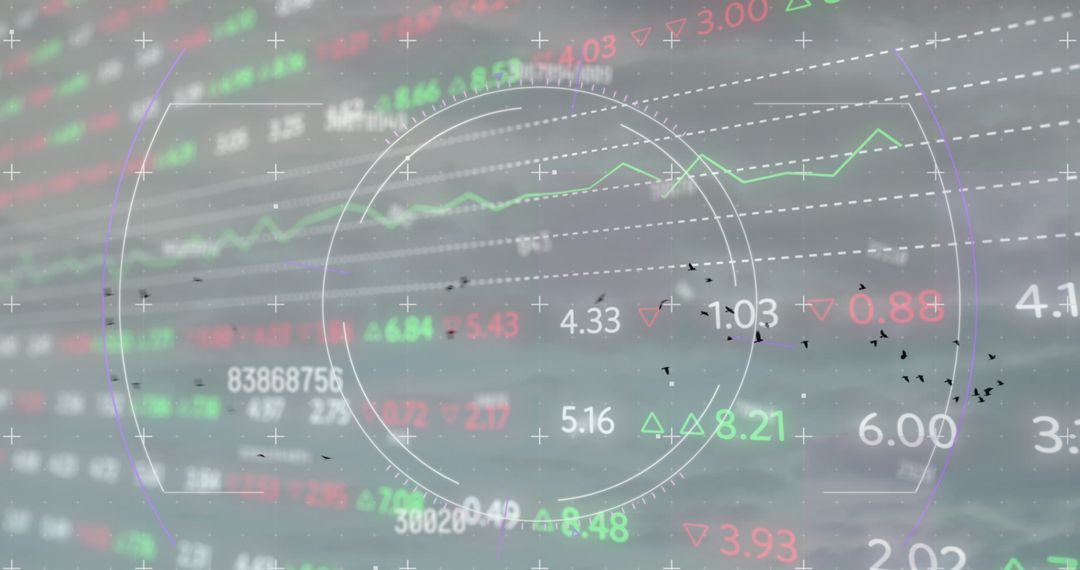
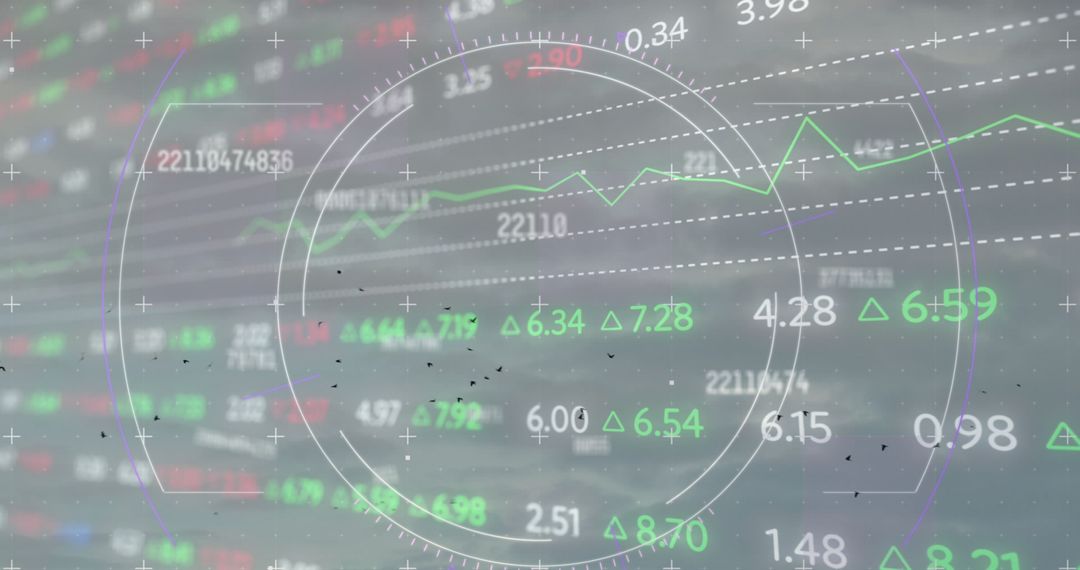
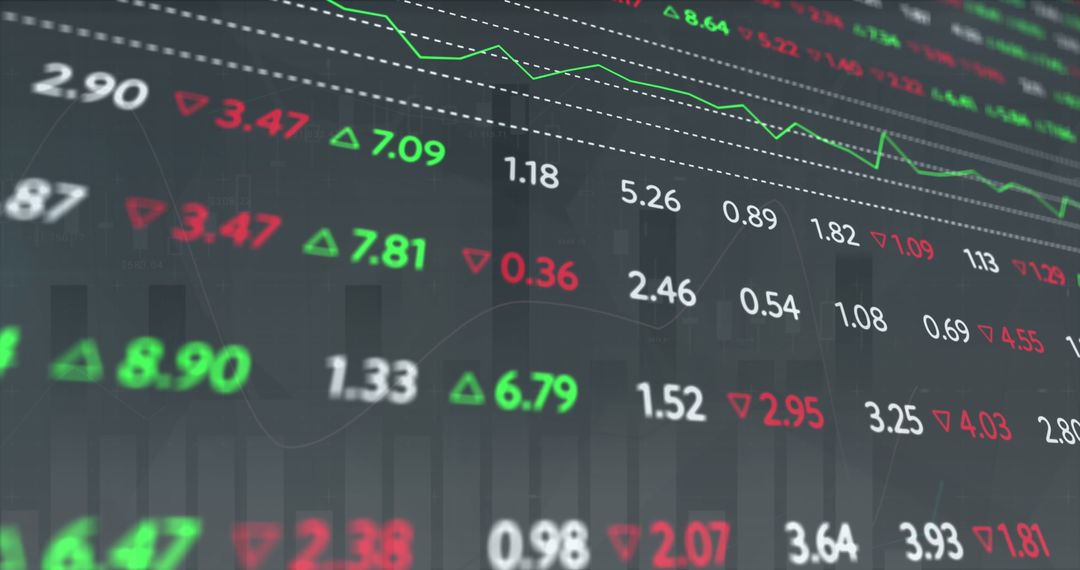
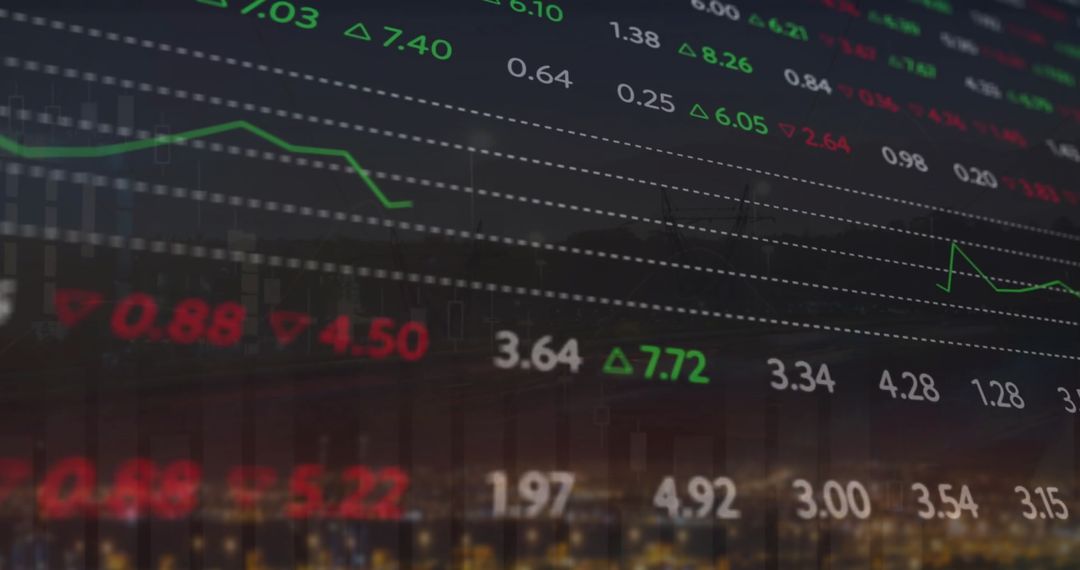
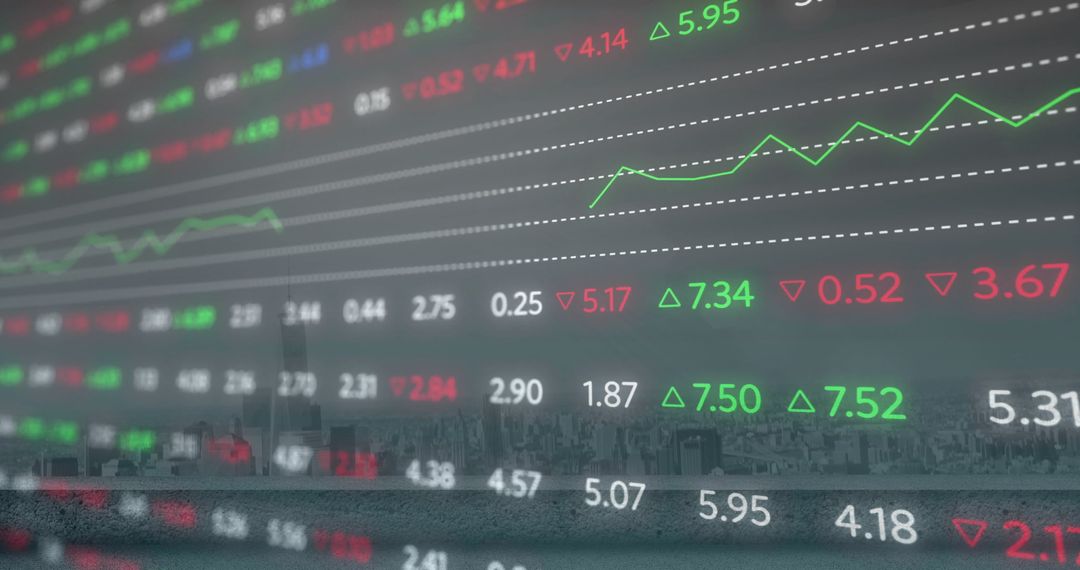
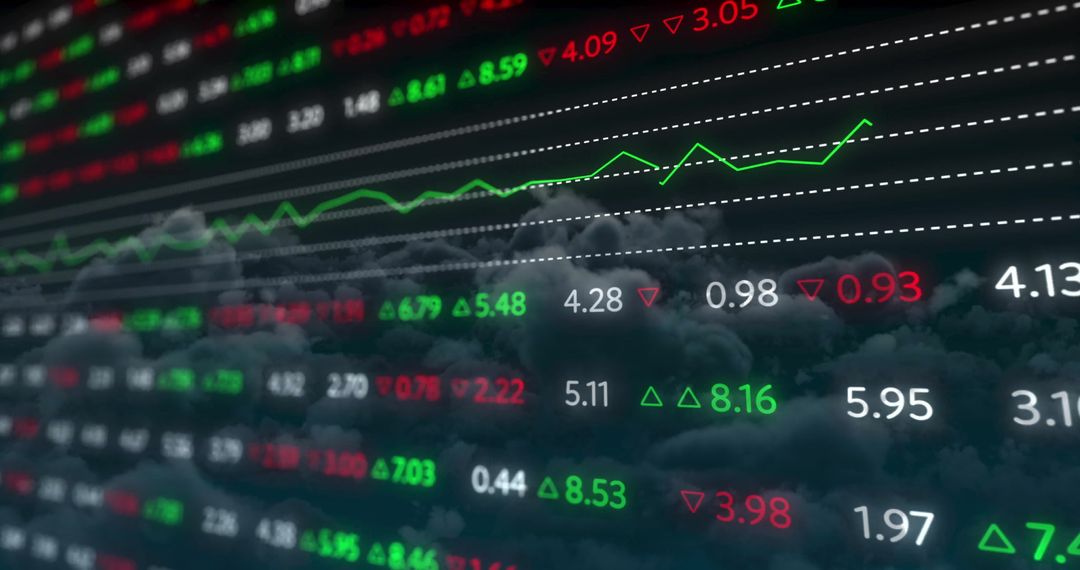
- Data Analytics and Global Market Trends Visualization
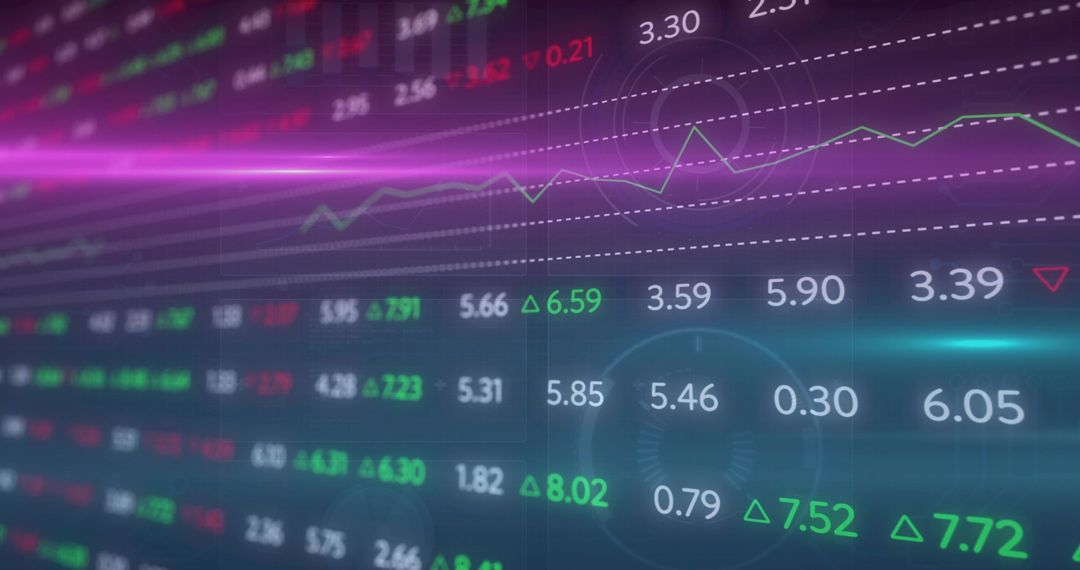
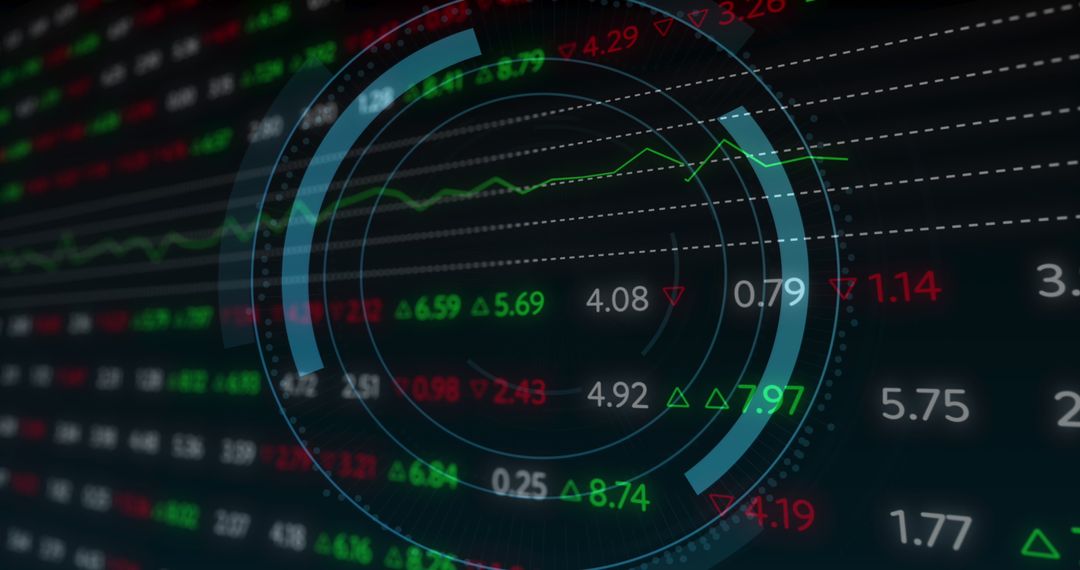
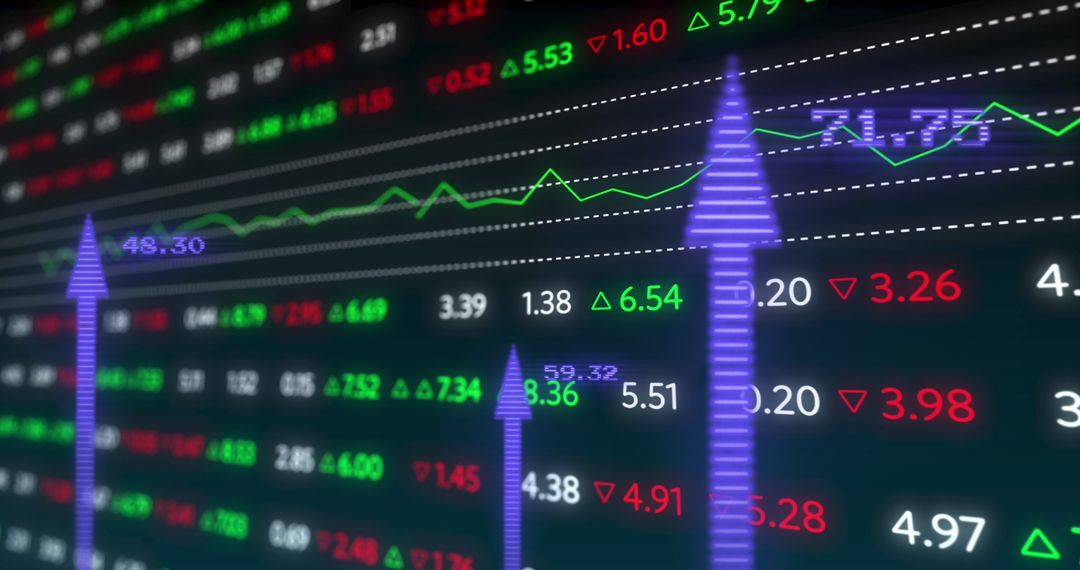
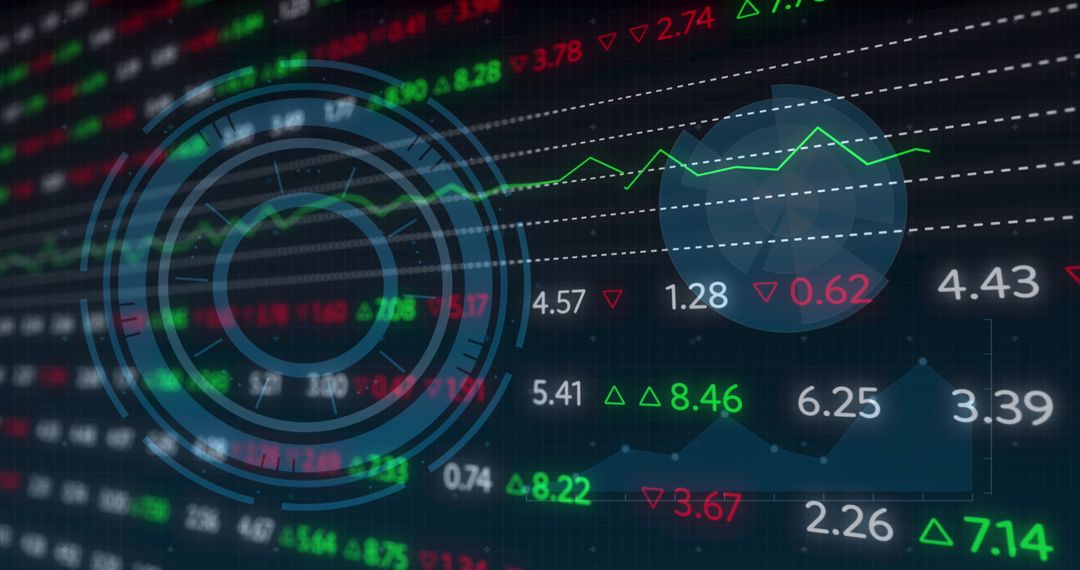
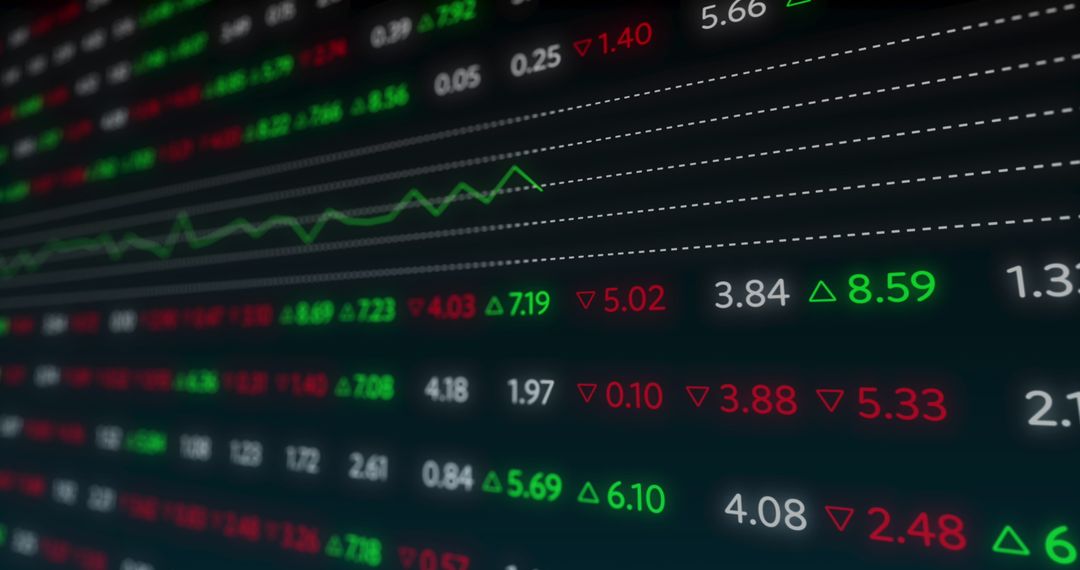
Data Analytics and Global Market Trends Visualization Image
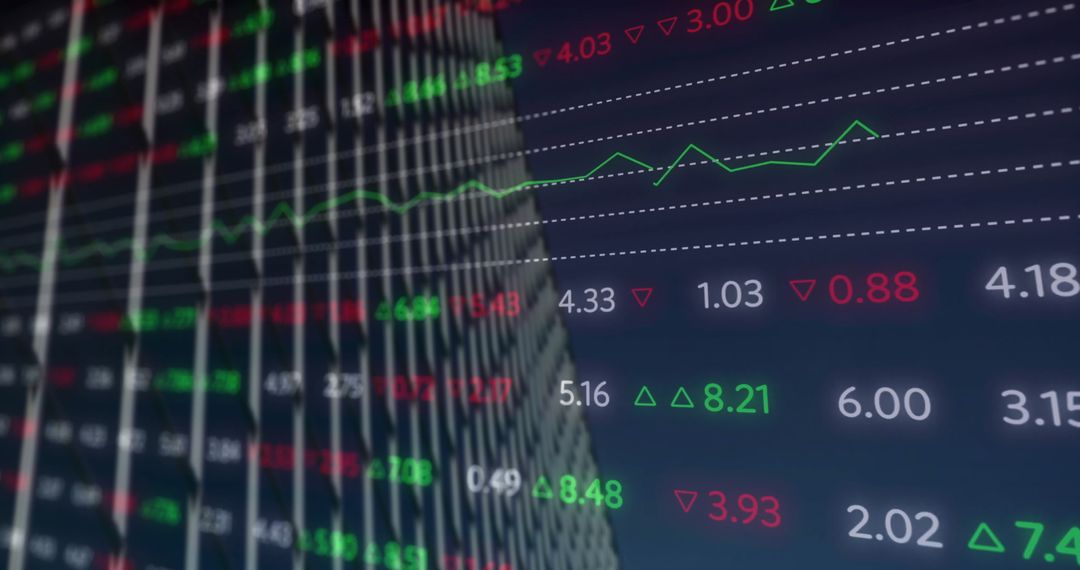
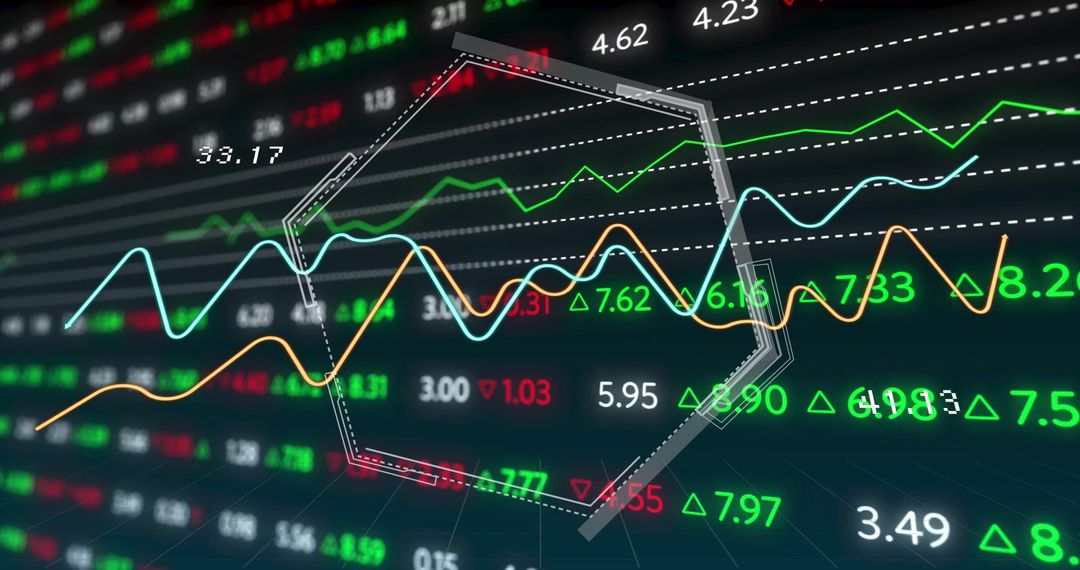
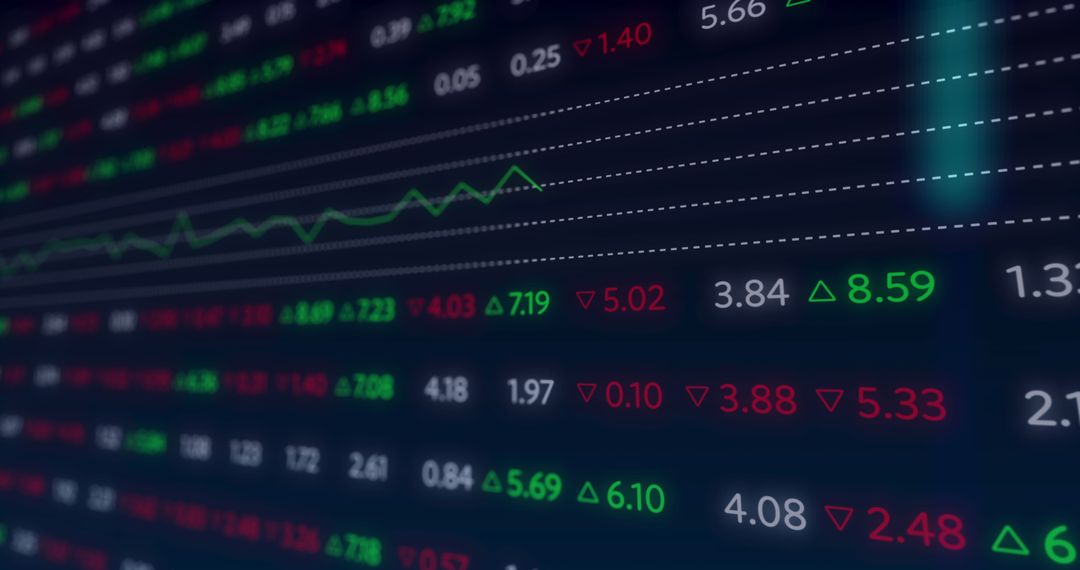
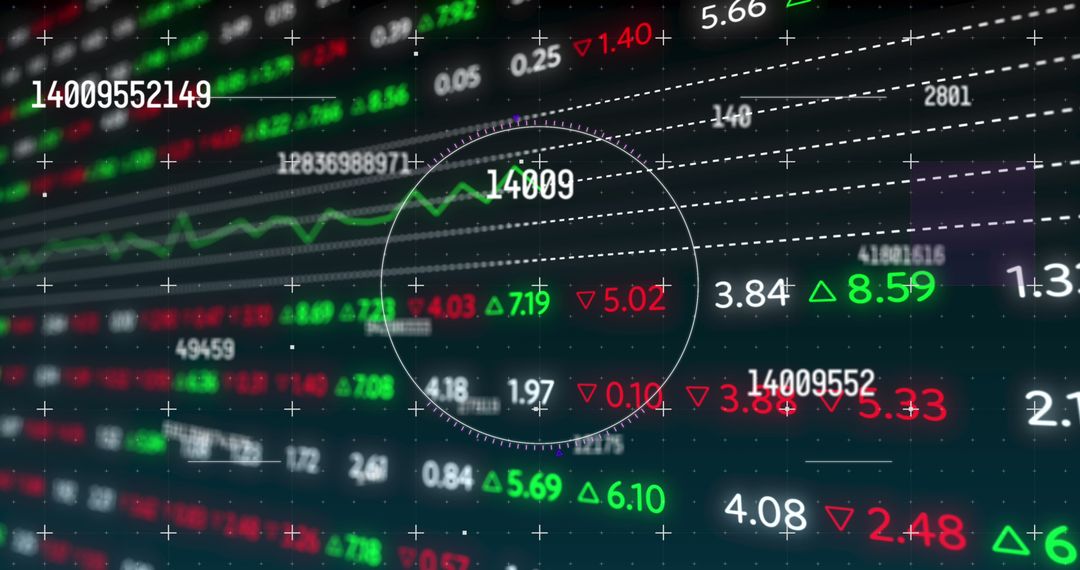
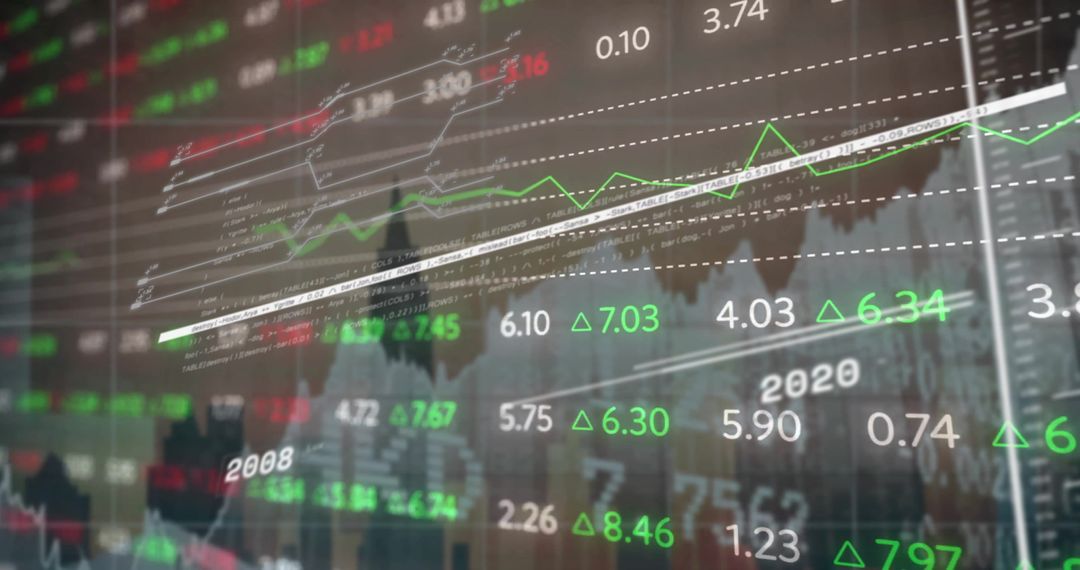
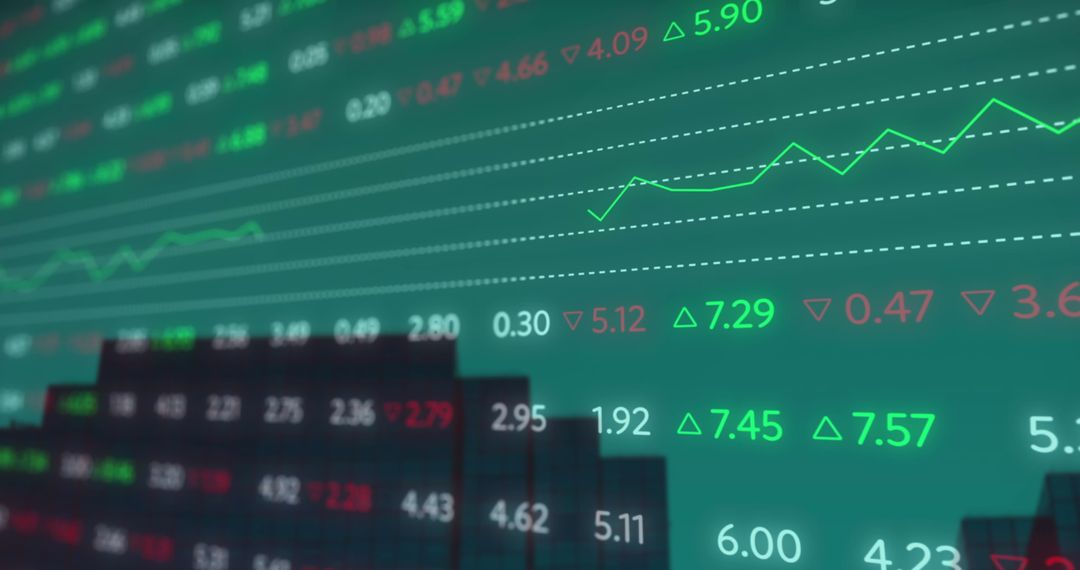
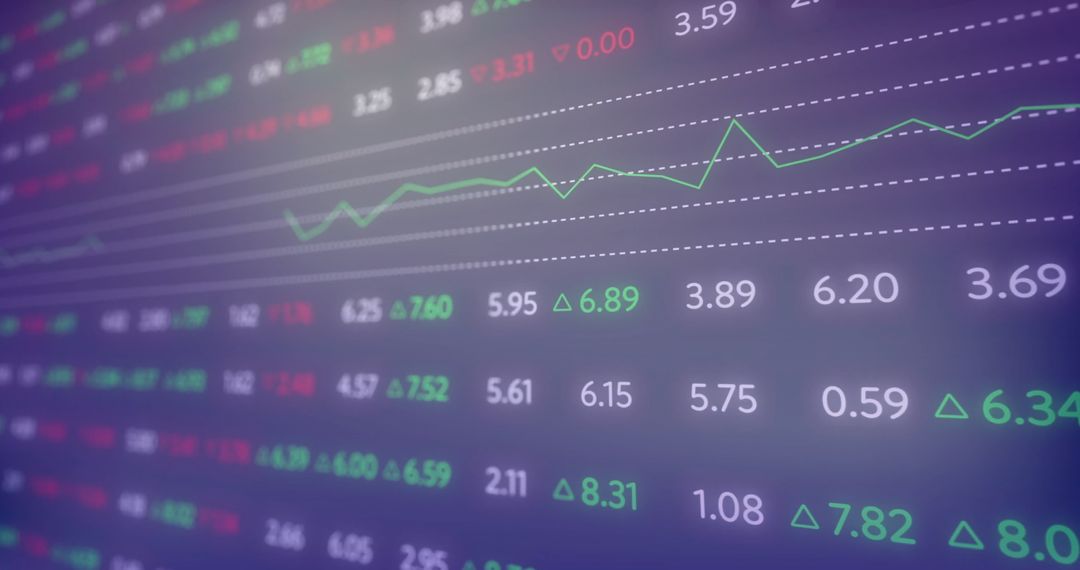
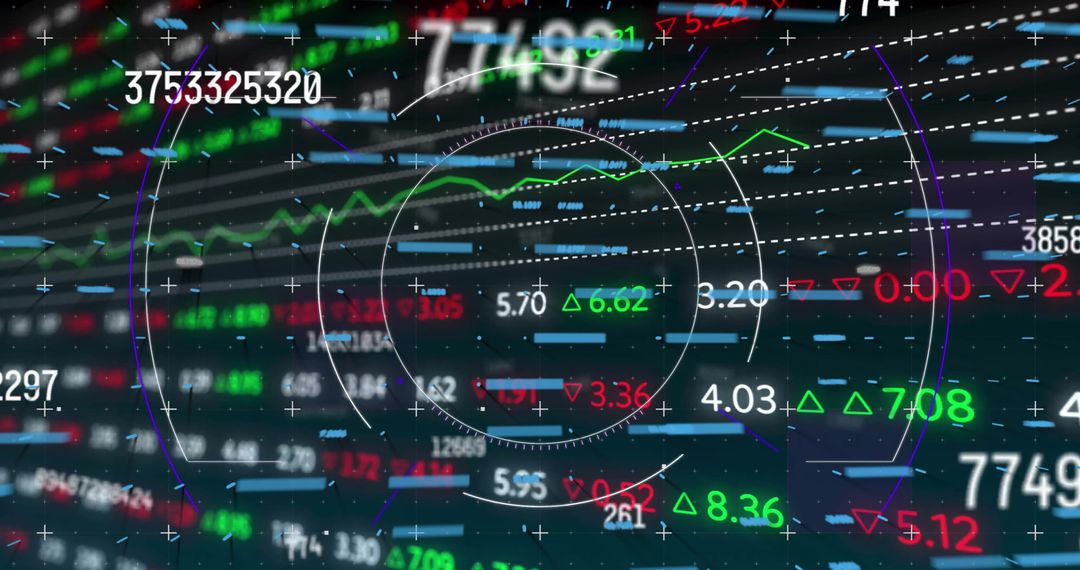
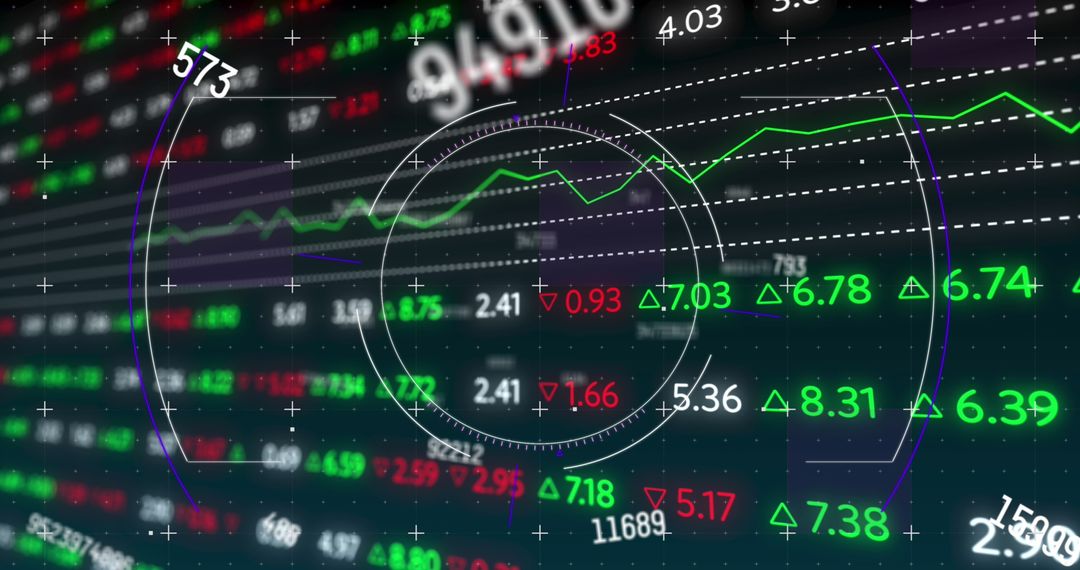
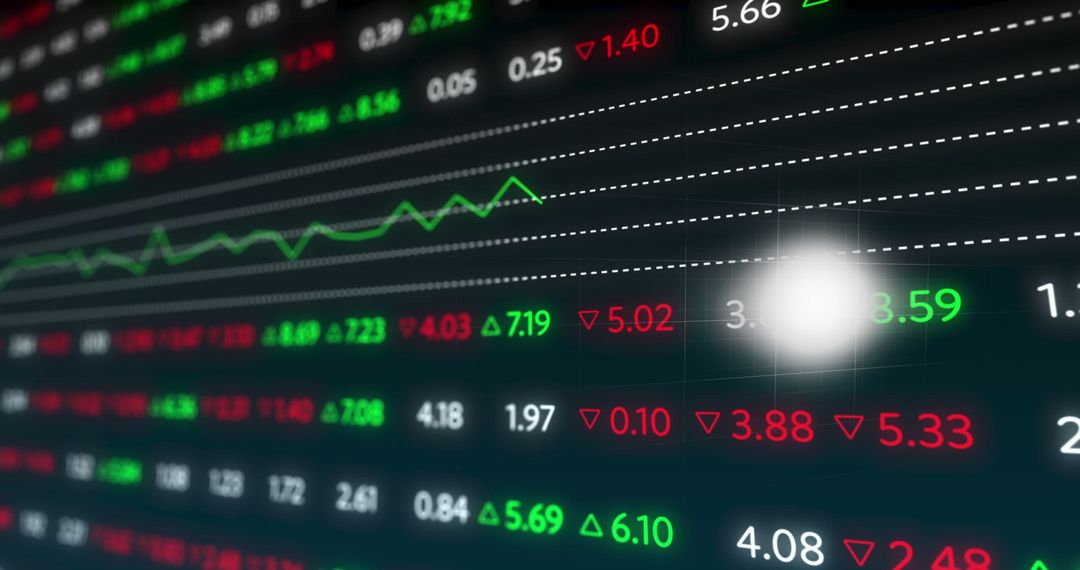
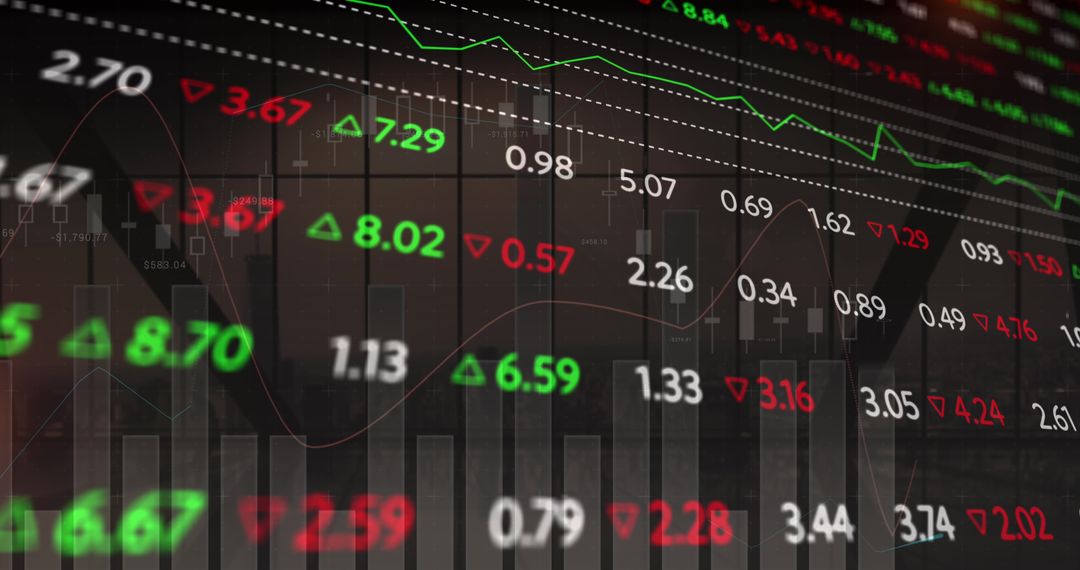
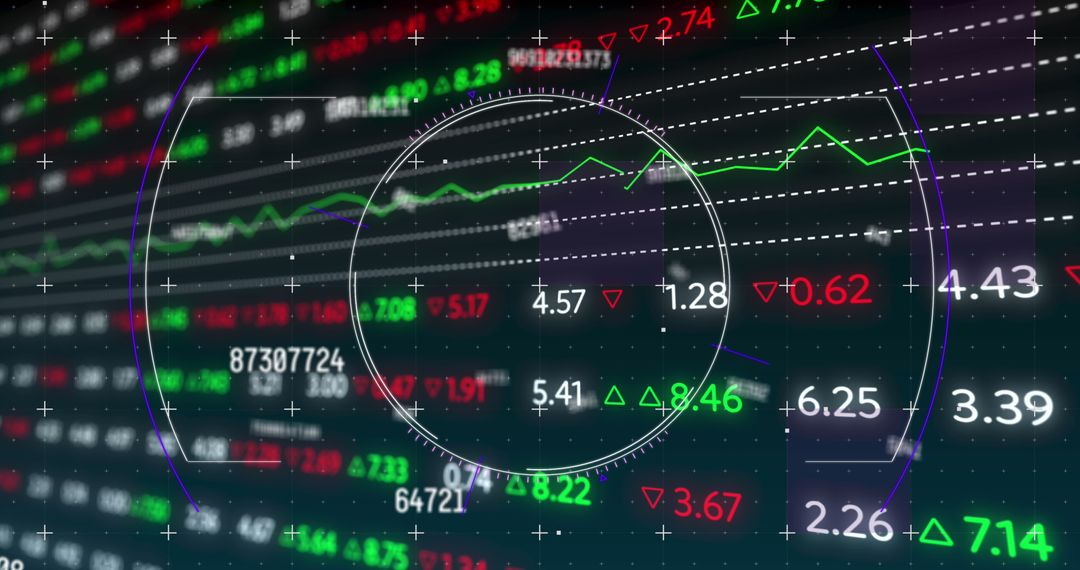
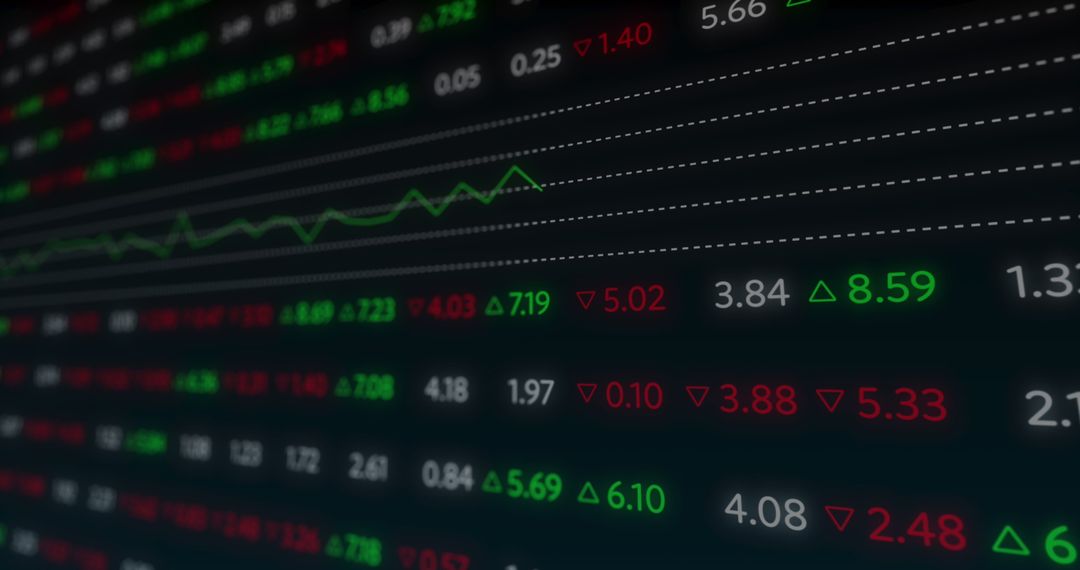
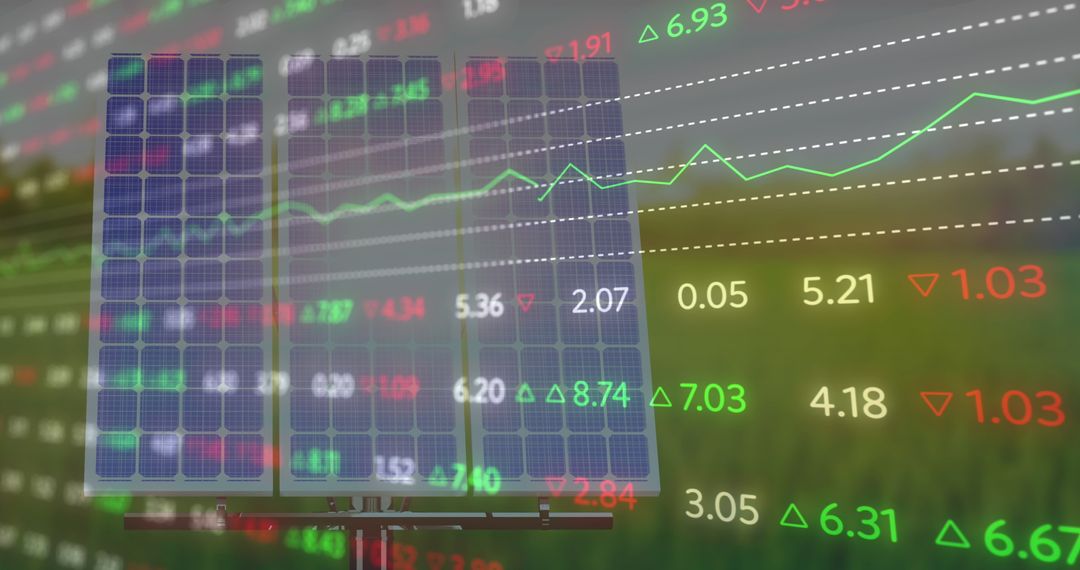
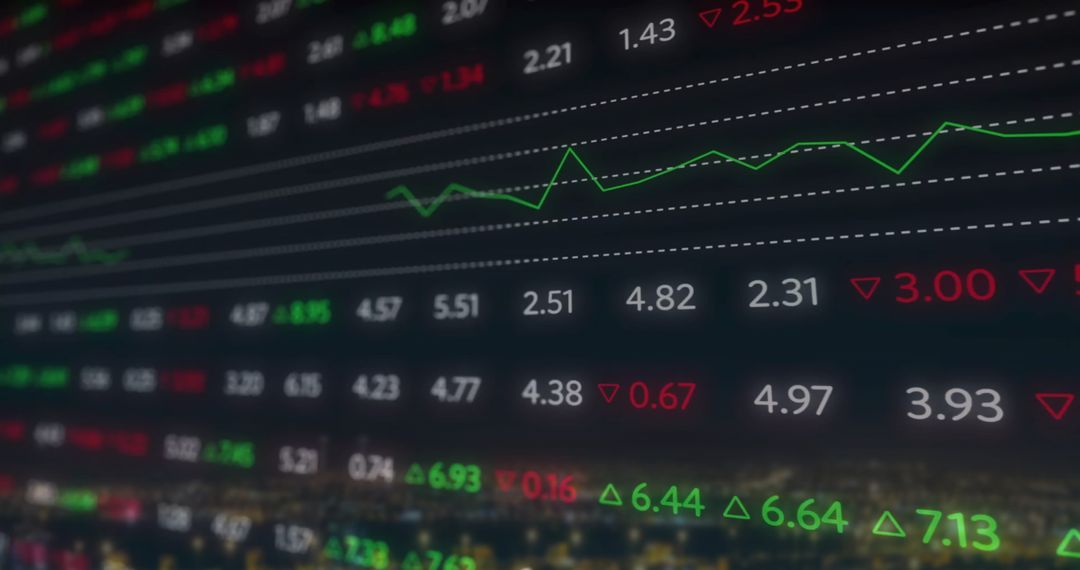
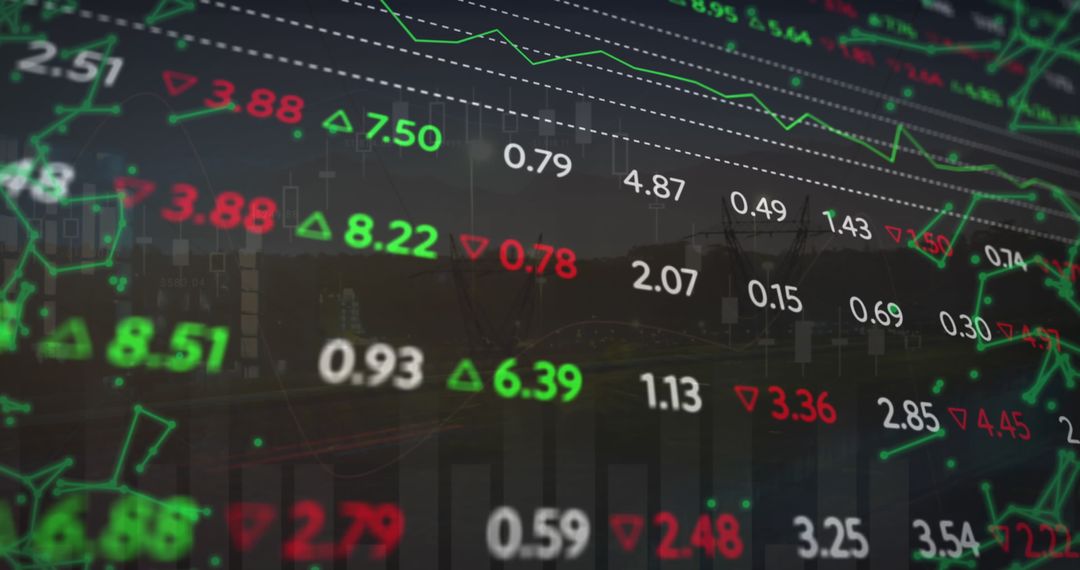
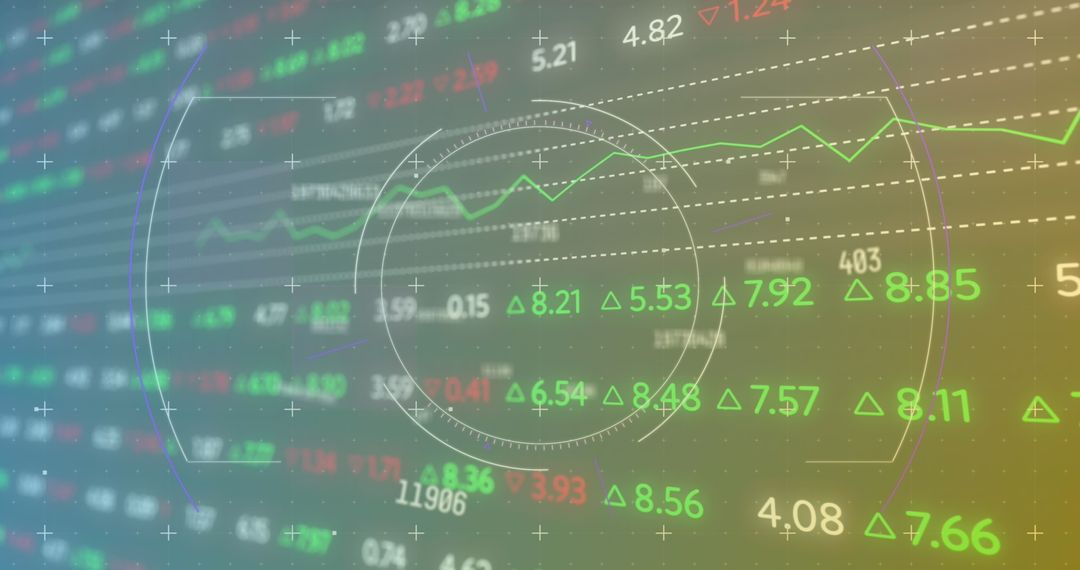
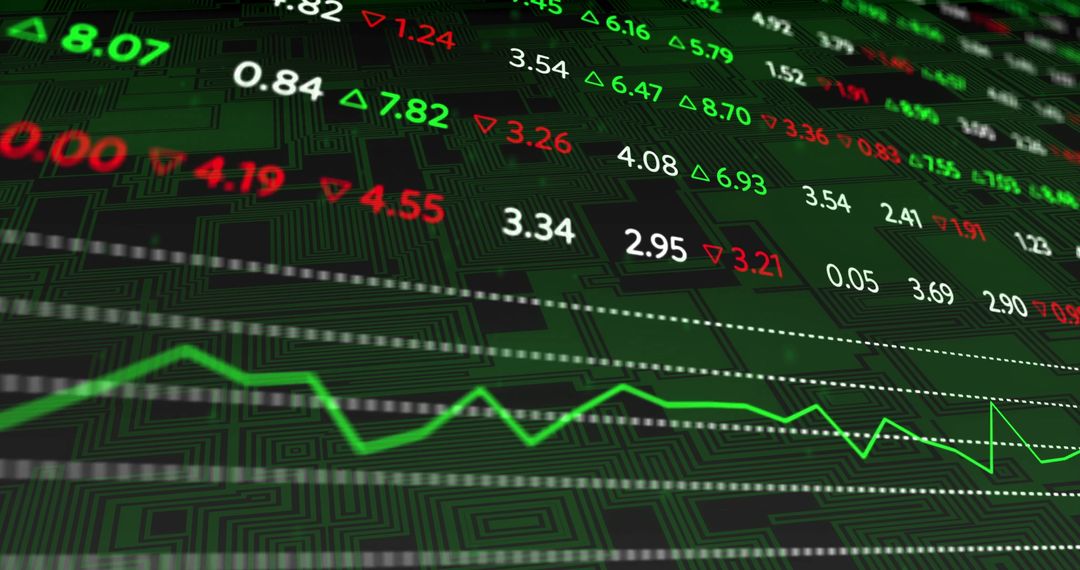
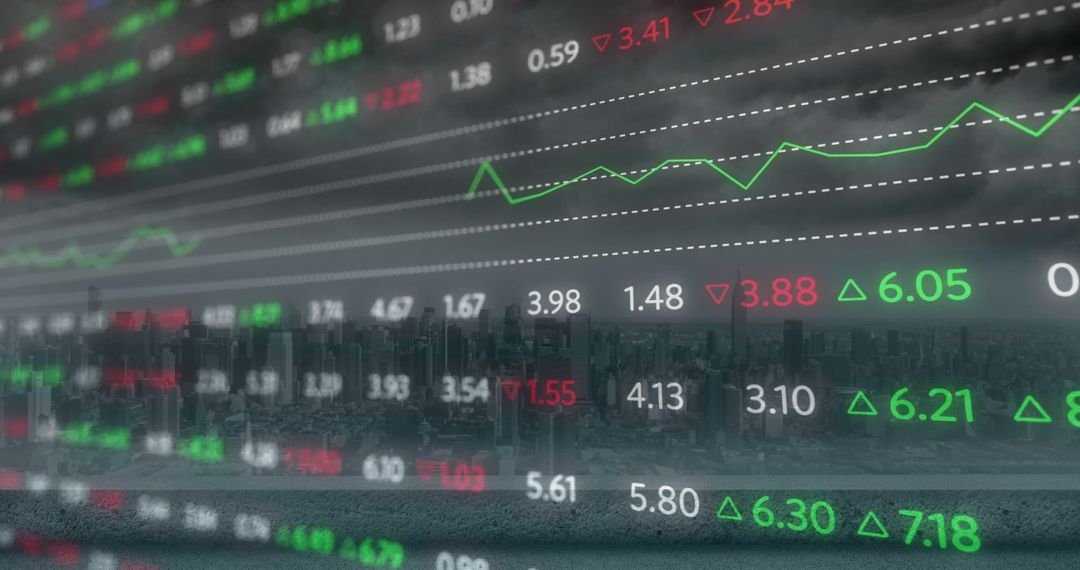
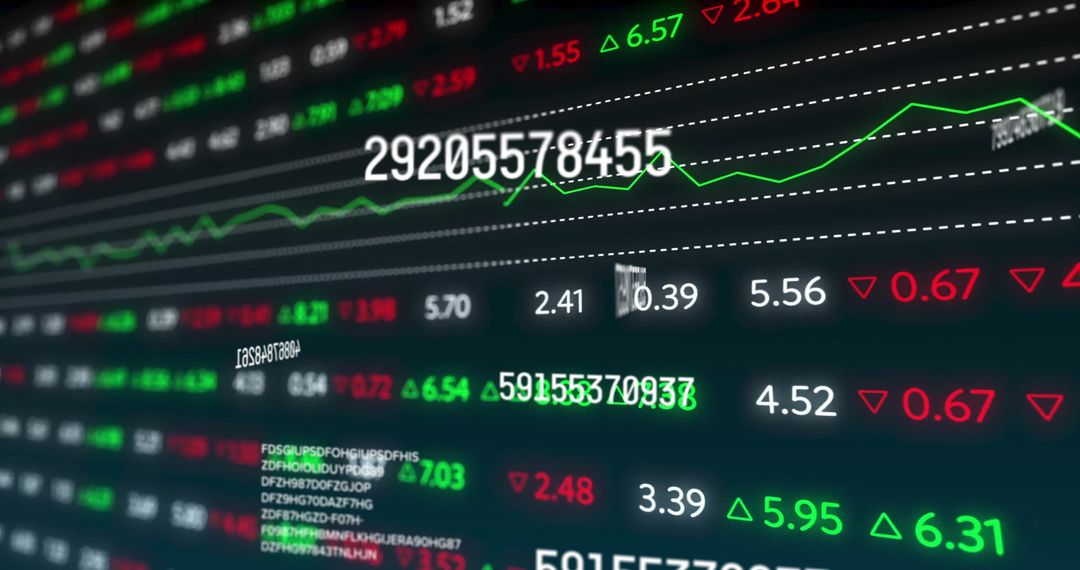
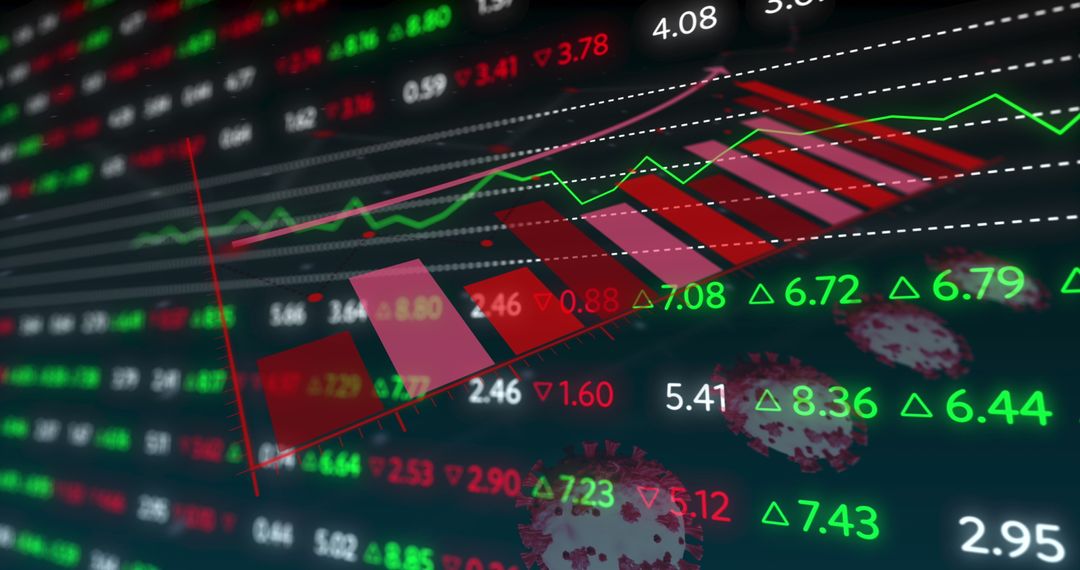
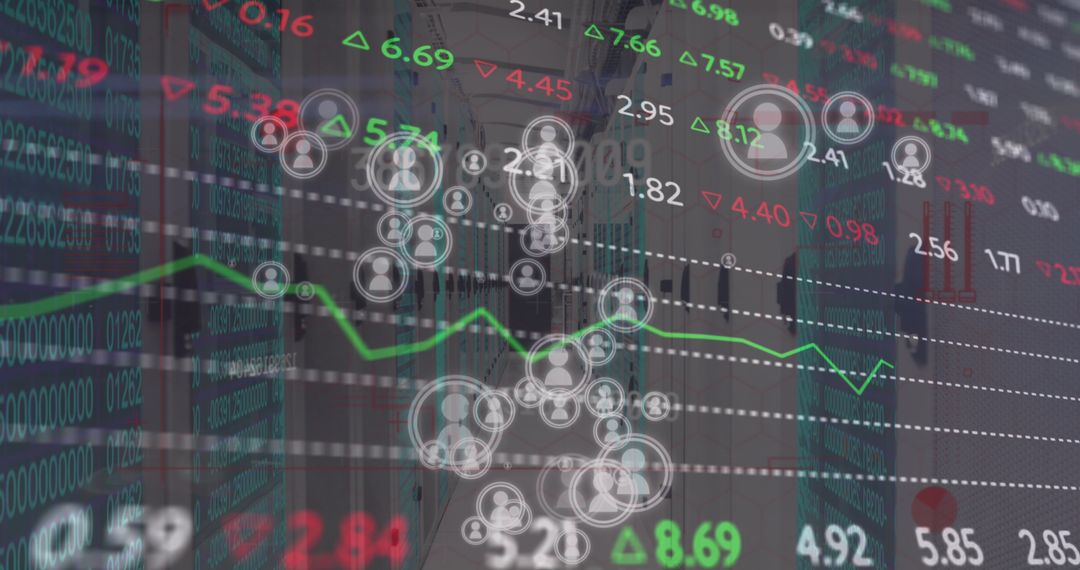
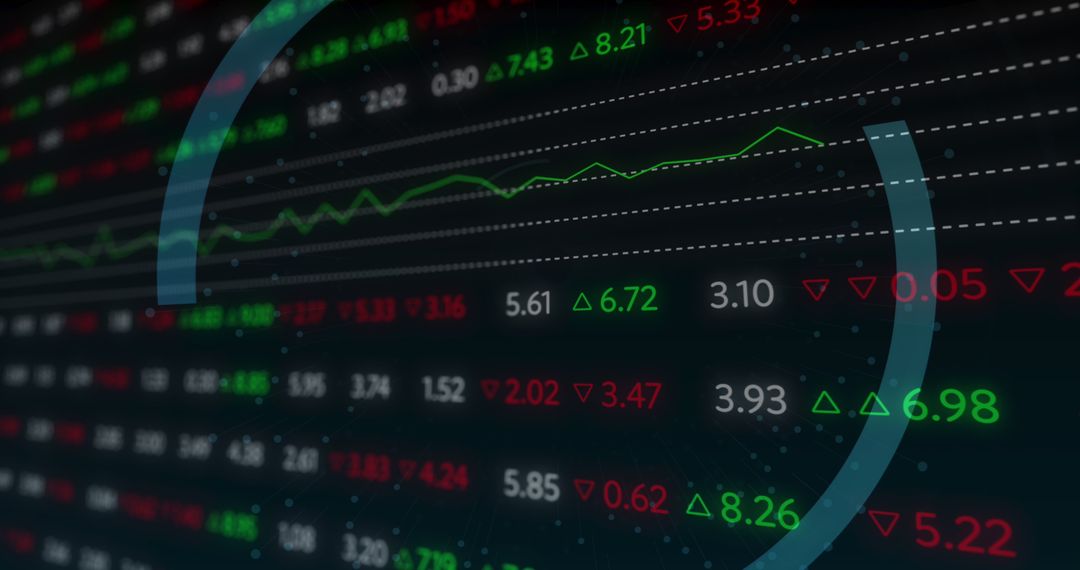
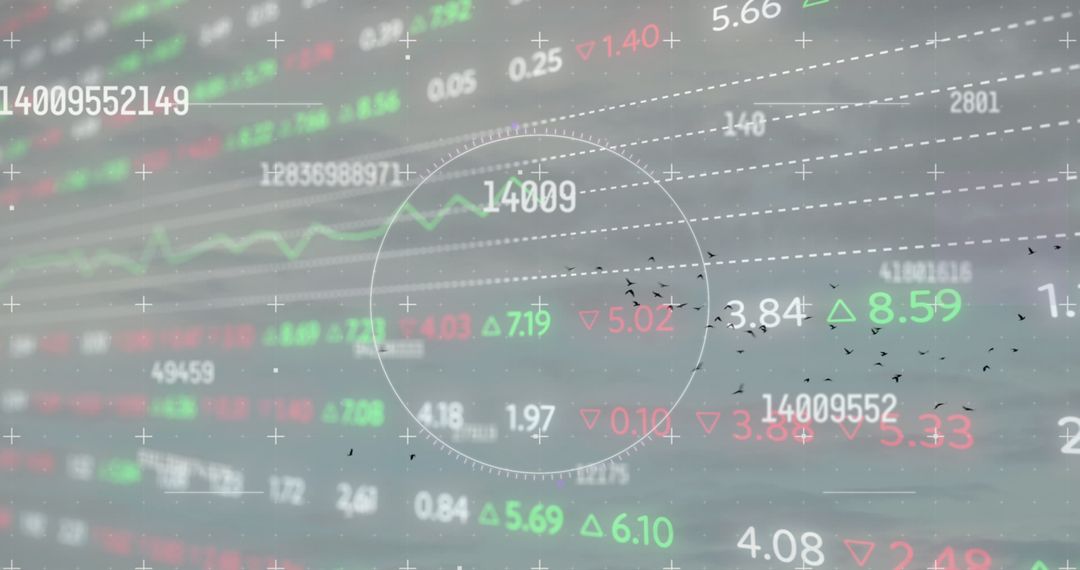
Visual representation of financial market data and trends, highlighting patterns and analytics in a digital space. Suitable for content related to business, finance, investment education, and technological innovation in data processing. Ideal for use in articles exploring stock market fluctuations, economic forecasting, or tutorials on data visualization techniques.
Powered by  - Get 15% off with code: PIKWIZARD15


2
downloads
downloads
Tags:
More
Credit Photo
If you would like to credit the Photo, here are some ways you can do so
Text Link
photo Link
<span class="text-link">
<span>
<a target="_blank" href=https://pikwizard.com/photo/data-analytics-and-global-market-trends-visualization/844a313f186a965b98a4251d16577468/>PikWizard</a>
</span>
</span>
<span class="image-link">
<span
style="margin: 0 0 20px 0; display: inline-block; vertical-align: middle; width: 100%;"
>
<a
target="_blank"
href="https://pikwizard.com/photo/data-analytics-and-global-market-trends-visualization/844a313f186a965b98a4251d16577468/"
style="text-decoration: none; font-size: 10px; margin: 0;"
>
<img src="https://pikwizard.com/pw/medium/844a313f186a965b98a4251d16577468.jpg" style="margin: 0; width: 100%;" alt="" />
<p style="font-size: 12px; margin: 0;">PikWizard</p>
</a>
</span>
</span>
Free (free of charge)
Free for personal and commercial use.
Author: Authentic Images
Similar Free Stock Images
Premium


Premium


Premium


Premium


Premium


Premium


Premium


Premium


Premium


Premium


Premium


Premium


Premium


Premium


Premium


Premium


Premium

Premium


Premium


Premium


Premium


Premium


Premium


Premium