- Home >
- Stock Photos >
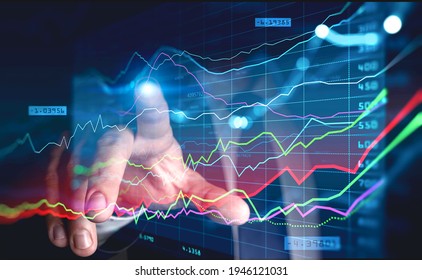
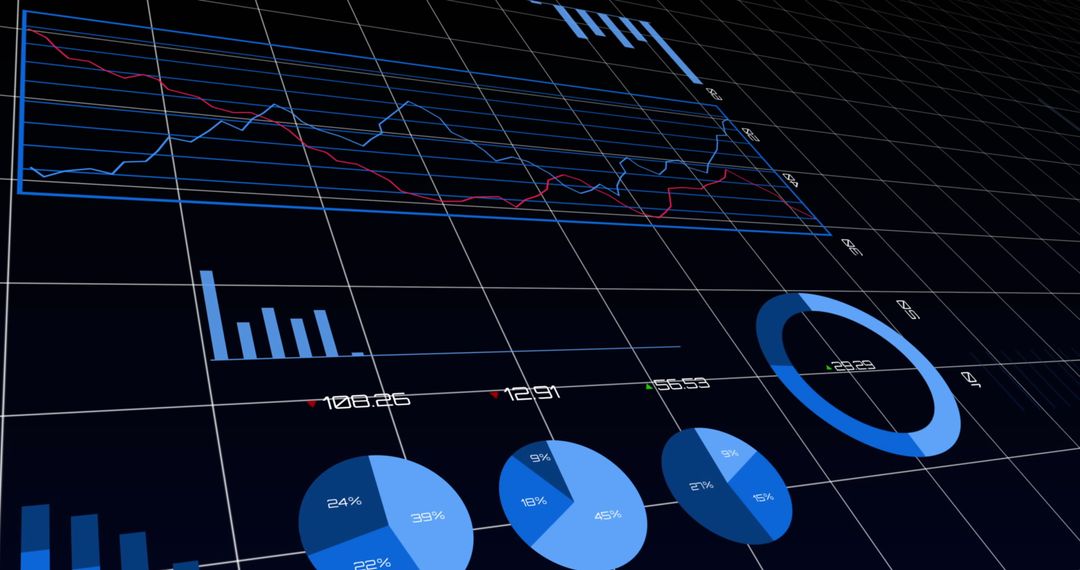
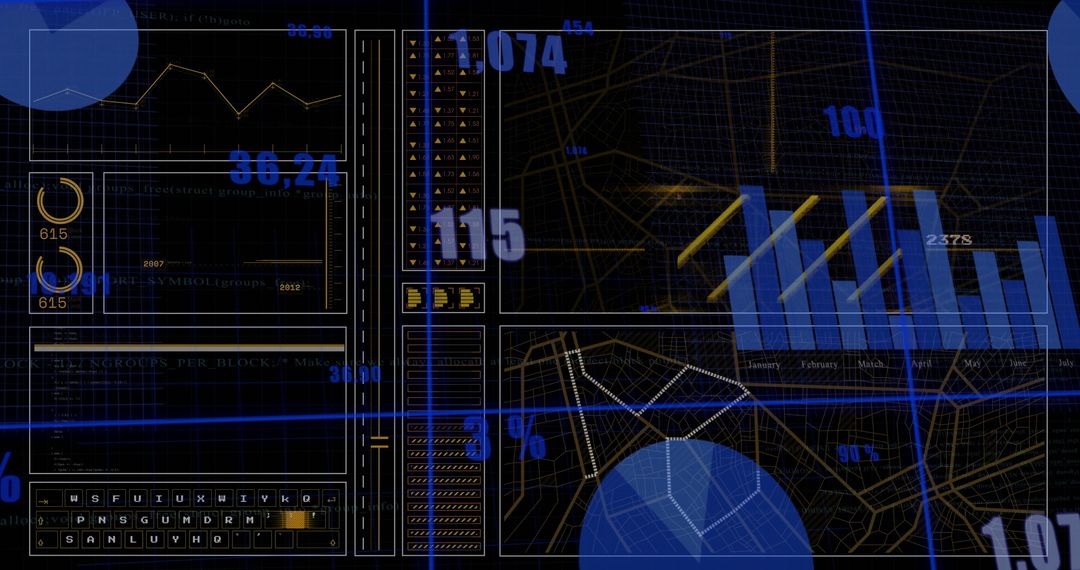
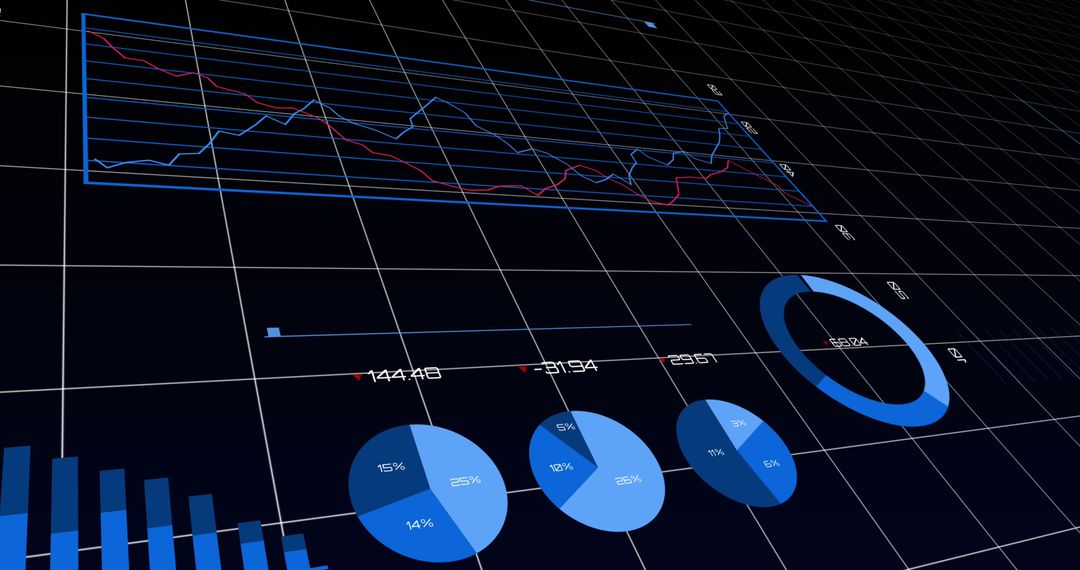
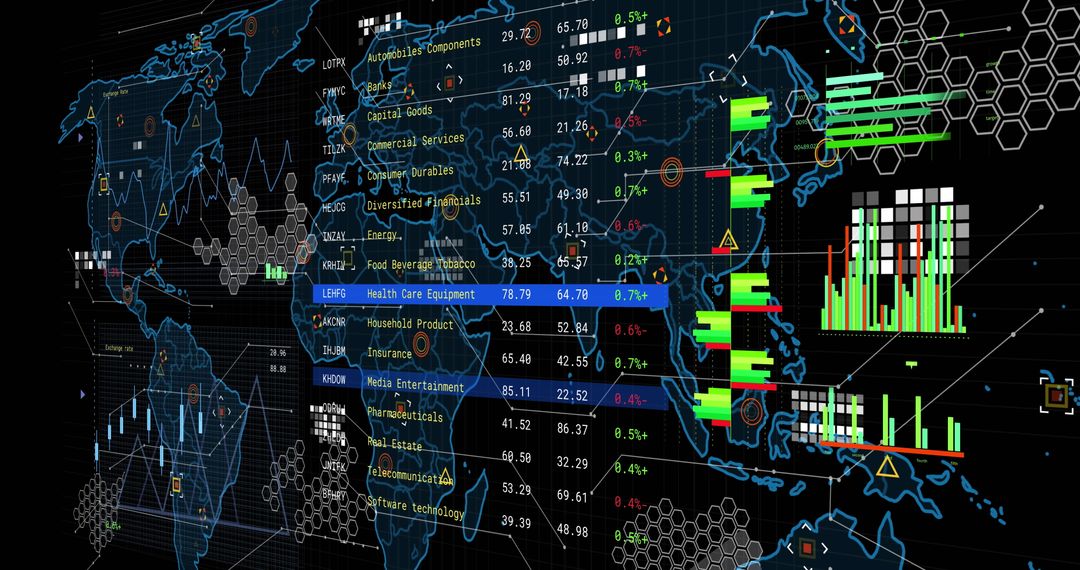
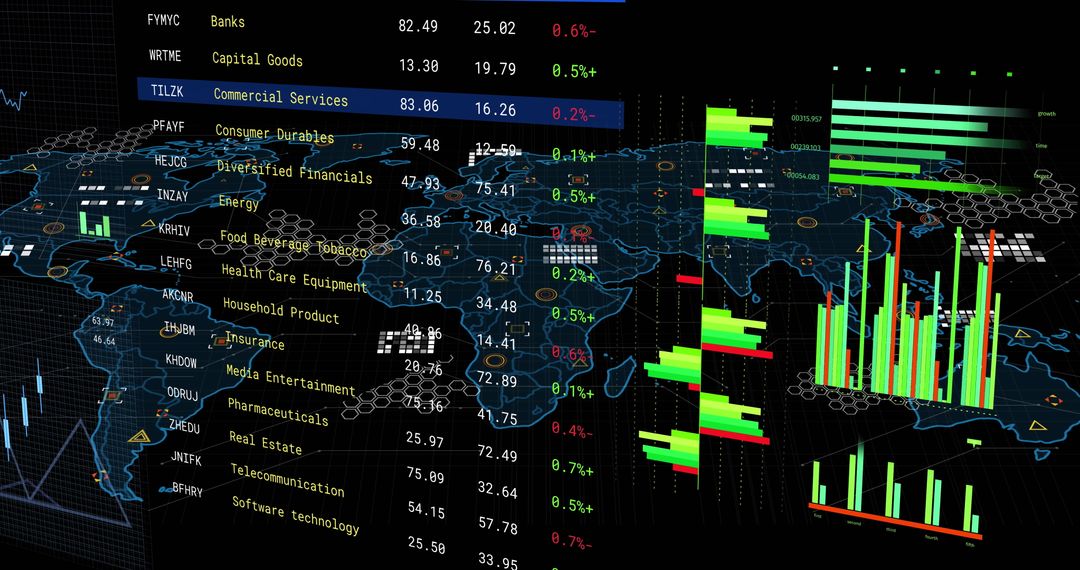
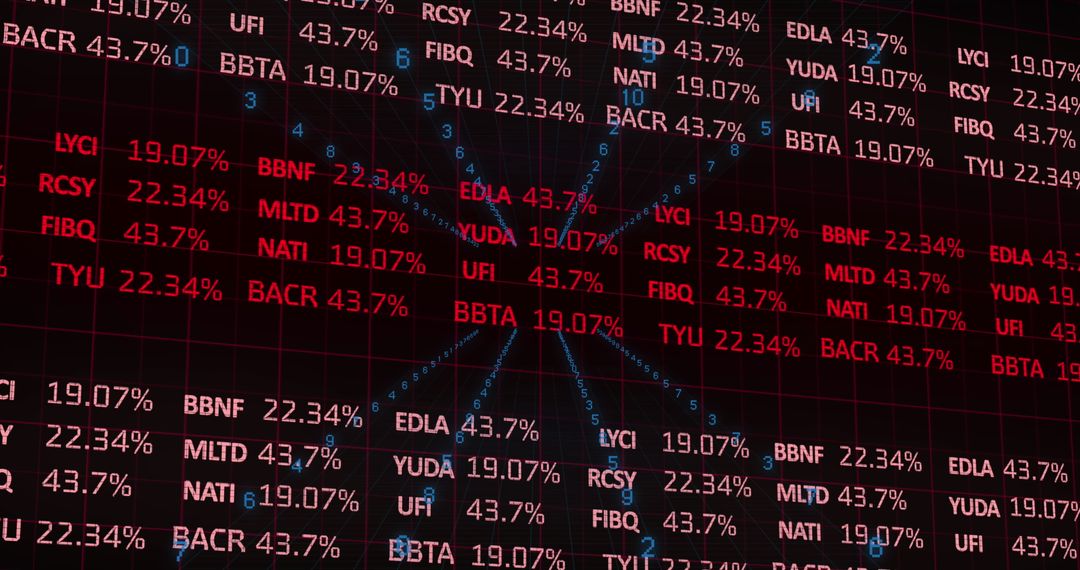
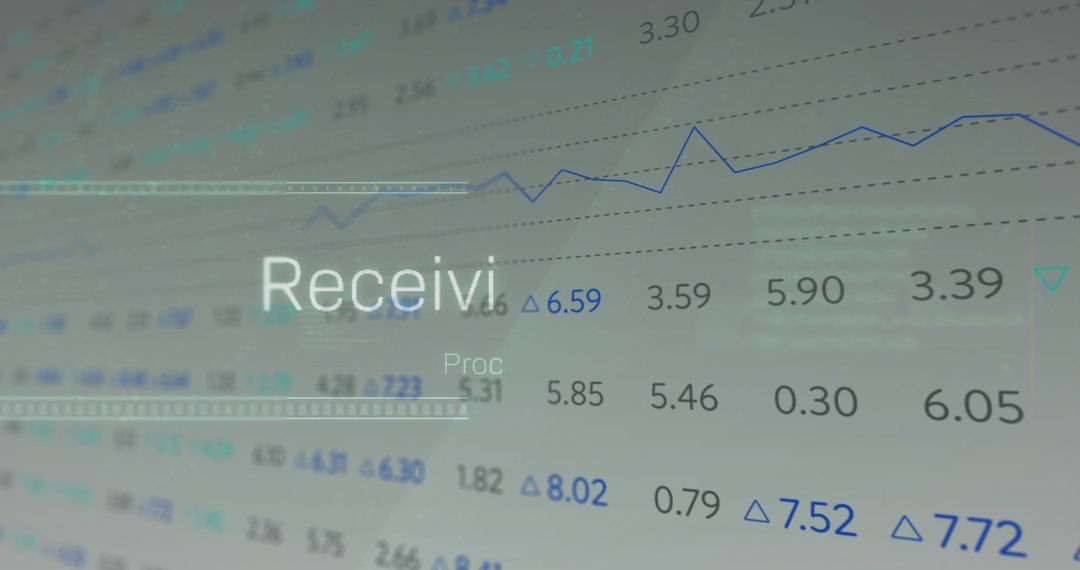
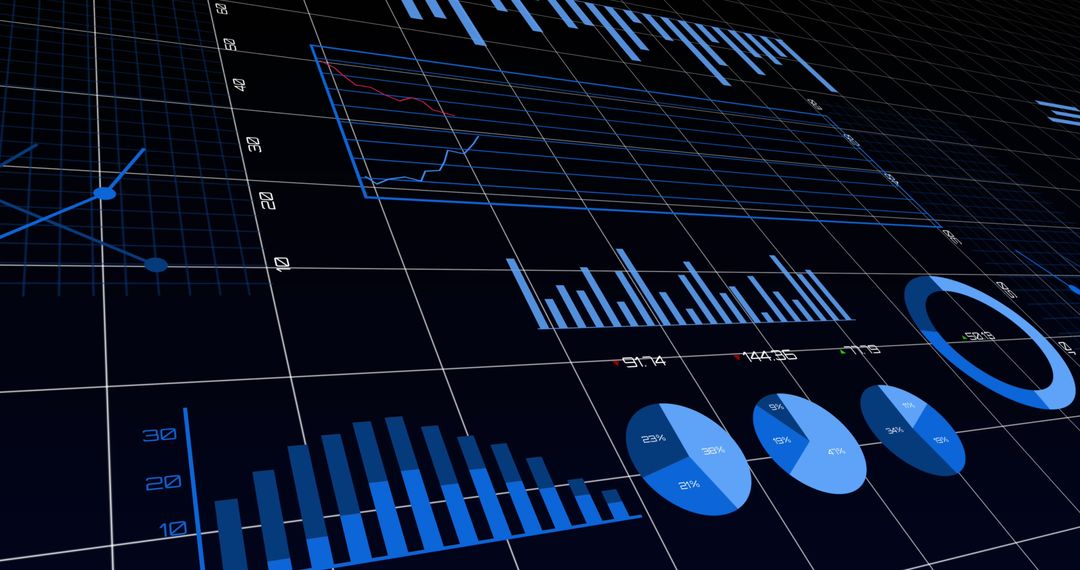
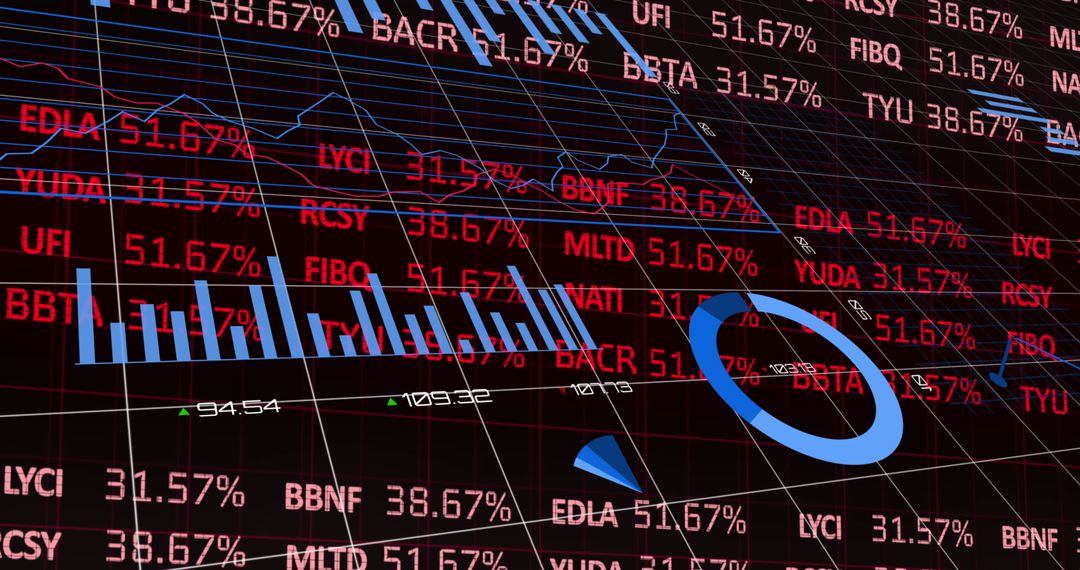
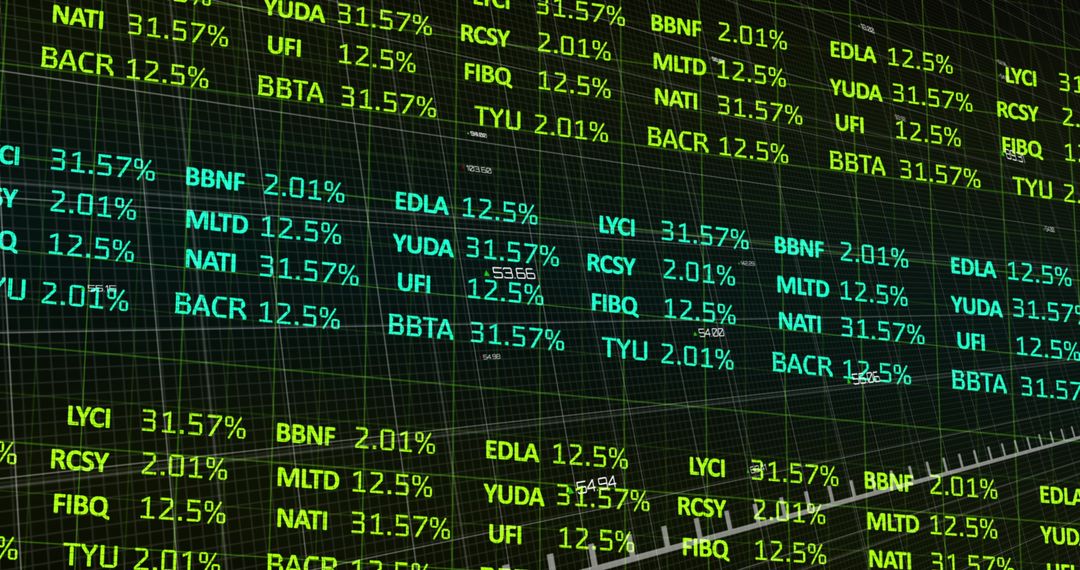
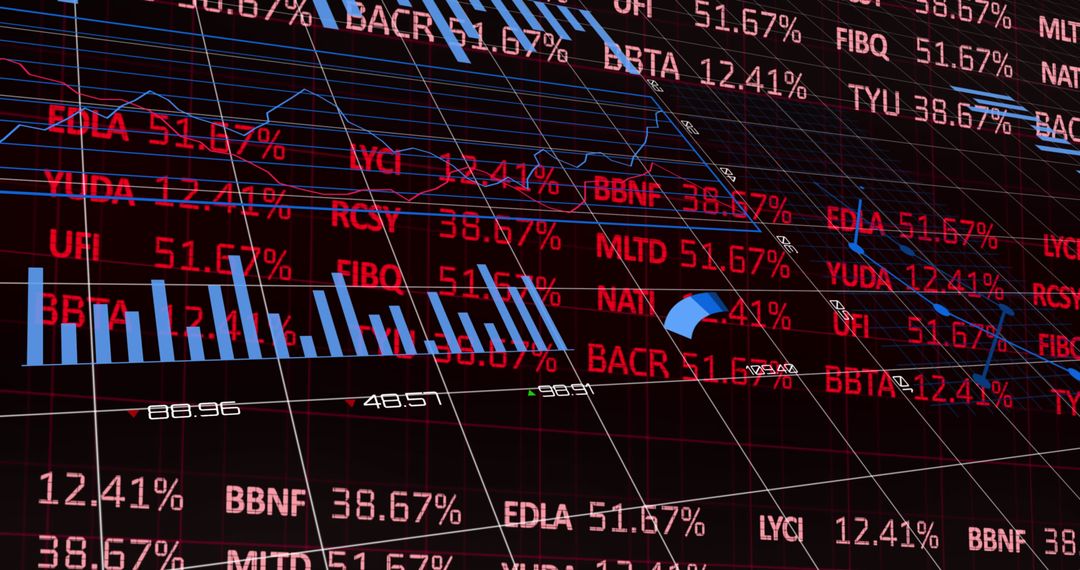
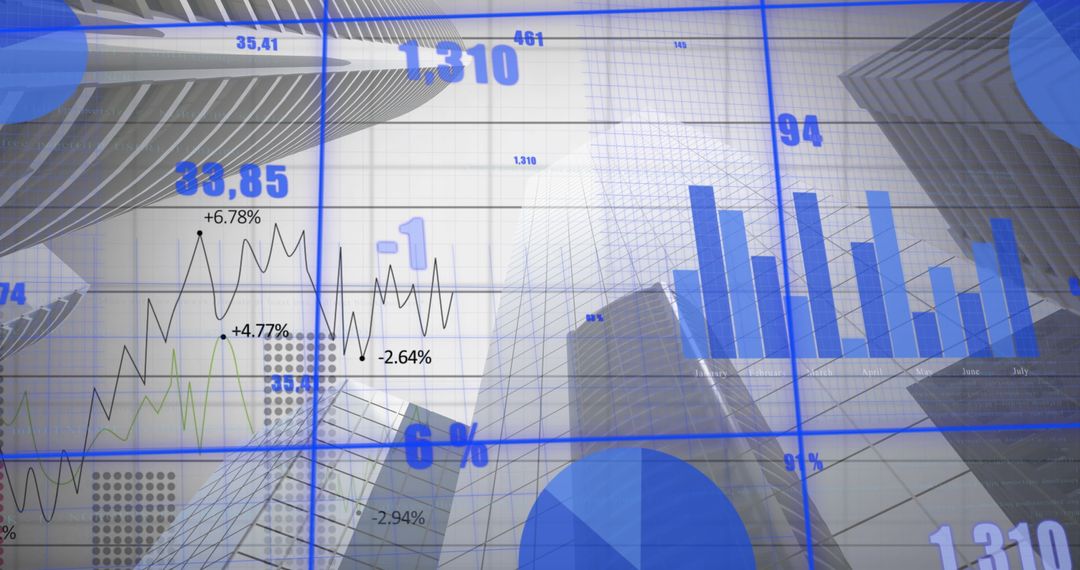
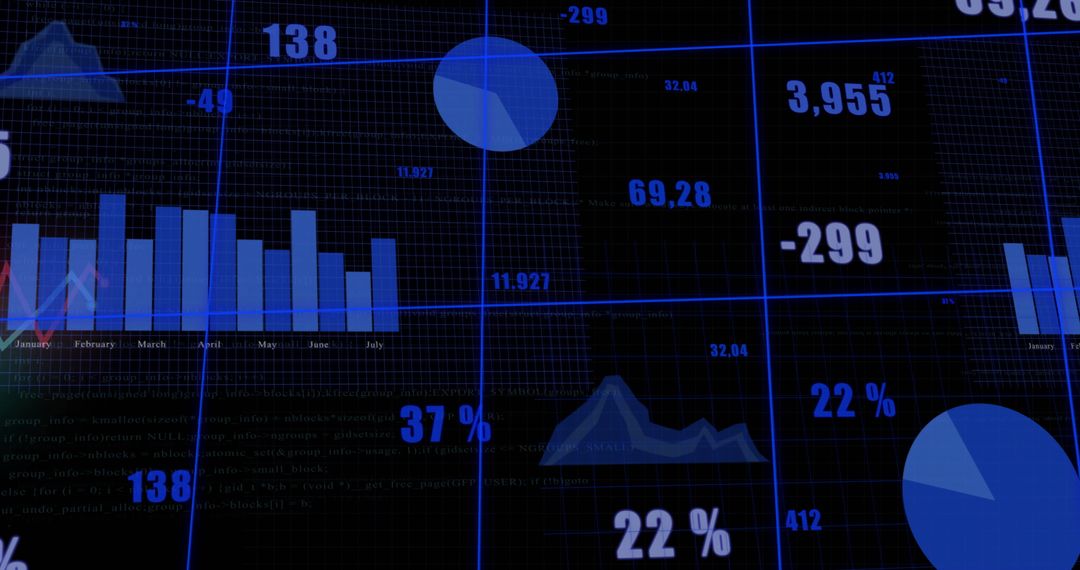
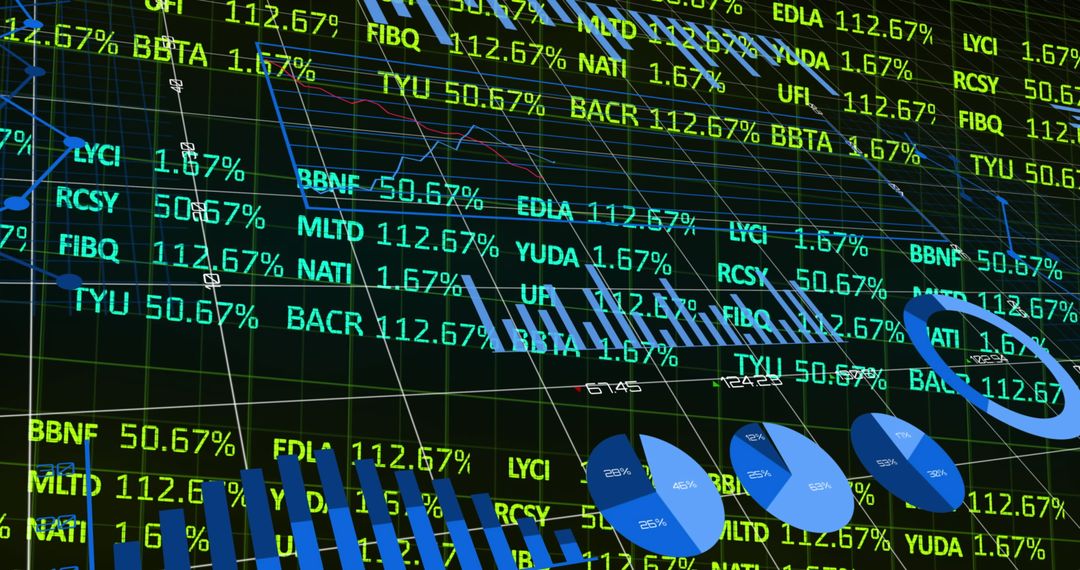
- Data Analytics and Stock Market Trends on Digital Display
Data Analytics and Stock Market Trends on Digital Display Image

This visually dynamic depiction of stock market data useful for illustrating financial reporting, business analytics, and investment strategies presentations. Ideal for use by financial experts, investment companies, and educational resources focused on economic trends.
Powered by  - Get 15% off with code: PIKWIZARD15


2
downloads
downloads
Tags:
More
Credit Photo
If you would like to credit the Photo, here are some ways you can do so
Text Link
photo Link
<span class="text-link">
<span>
<a target="_blank" href=https://pikwizard.com/photo/data-analytics-and-stock-market-trends-on-digital-display/0ece916dbef5ab2ef353a48947b75be9/>PikWizard</a>
</span>
</span>
<span class="image-link">
<span
style="margin: 0 0 20px 0; display: inline-block; vertical-align: middle; width: 100%;"
>
<a
target="_blank"
href="https://pikwizard.com/photo/data-analytics-and-stock-market-trends-on-digital-display/0ece916dbef5ab2ef353a48947b75be9/"
style="text-decoration: none; font-size: 10px; margin: 0;"
>
<img src="https://pikwizard.com/pw/medium/0ece916dbef5ab2ef353a48947b75be9.jpg" style="margin: 0; width: 100%;" alt="" />
<p style="font-size: 12px; margin: 0;">PikWizard</p>
</a>
</span>
</span>
Free (free of charge)
Free for personal and commercial use.
Author: Awesome Content
Similar Free Stock Images

Premium


Premium


Premium


Premium


Premium


Premium


Premium


Premium


Premium


Premium


Premium


Premium


Premium


Premium

Premium


Premium


Premium


Premium


Premium

Premium


Premium


Premium


Premium


Premium