- Home >
- Stock Photos >
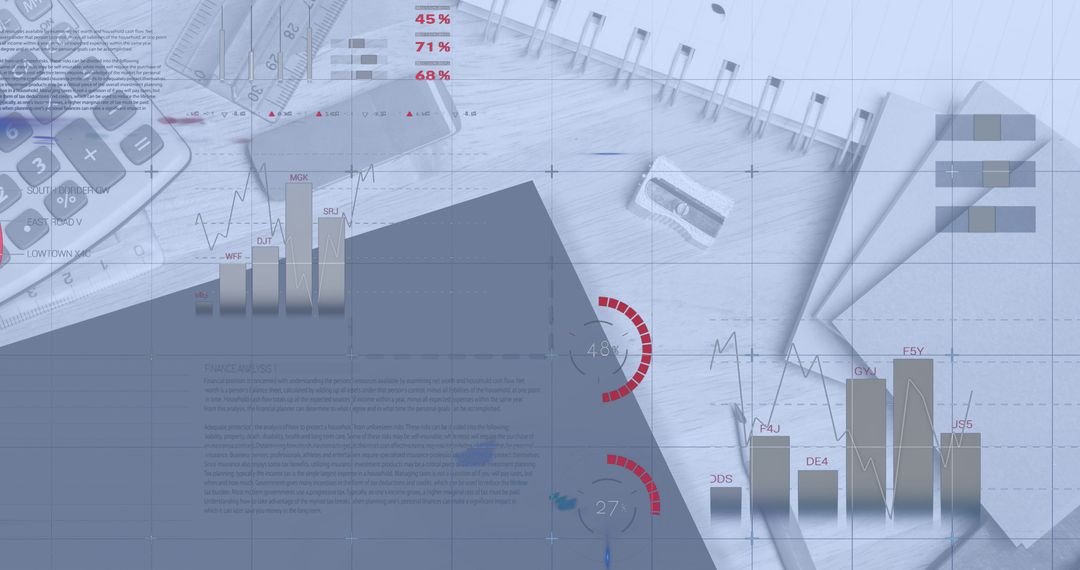
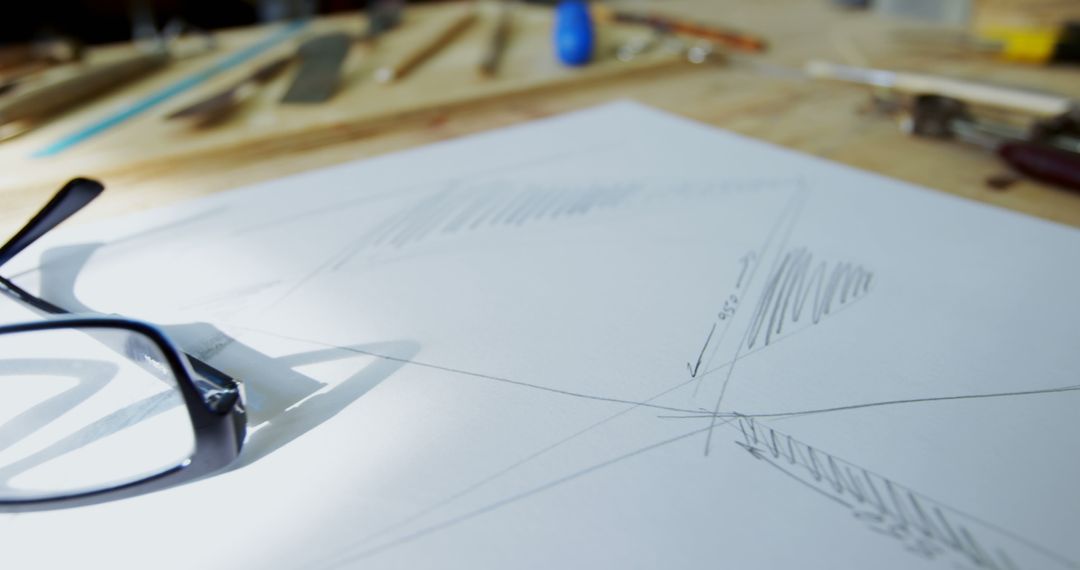
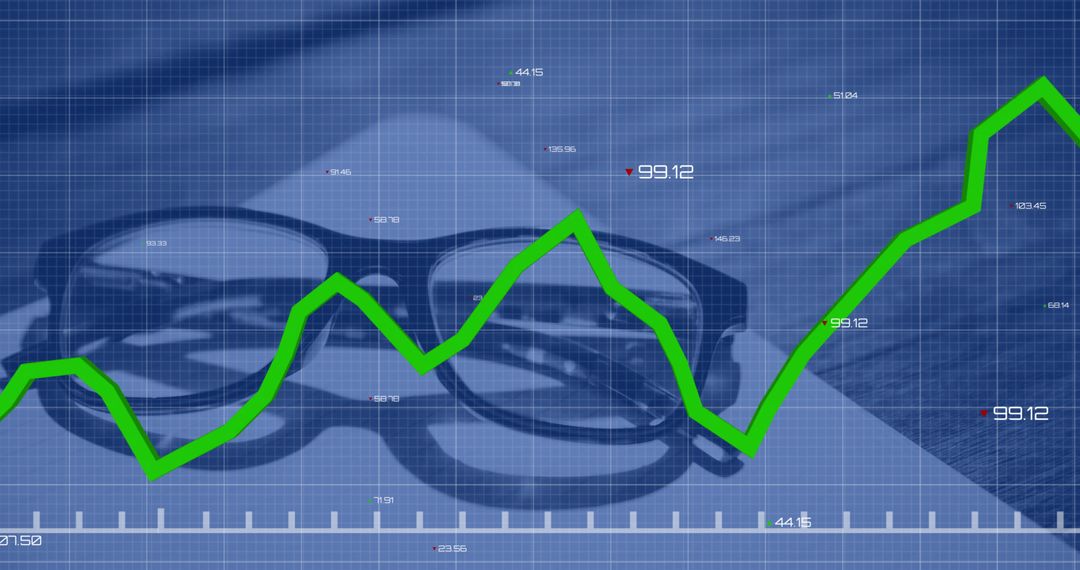
- Data Analytics Concept with Glasses and Tablet on Wooden Desk
Data Analytics Concept with Glasses and Tablet on Wooden Desk Image

A pair of reading glasses rests beside a tablet on a wooden desk, highlighted by a dynamic data overlay featuring red lines and numbers. Ideal for representing concepts of technology integration, business analytics, innovation, and data-driven finance solutions. Suitable for use in business marketing materials, technology and finance blog posts, and academic presentations about data analysis.
Powered by  - Get 15% off with code: PIKWIZARD15


0
downloads
downloads
Tags:
More
Credit Photo
If you would like to credit the Photo, here are some ways you can do so
Text Link
photo Link
<span class="text-link">
<span>
<a target="_blank" href=https://pikwizard.com/photo/data-analytics-concept-with-glasses-and-tablet-on-wooden-desk/72c8e68bbeb64313b0b5c28f8a66f51f/>PikWizard</a>
</span>
</span>
<span class="image-link">
<span
style="margin: 0 0 20px 0; display: inline-block; vertical-align: middle; width: 100%;"
>
<a
target="_blank"
href="https://pikwizard.com/photo/data-analytics-concept-with-glasses-and-tablet-on-wooden-desk/72c8e68bbeb64313b0b5c28f8a66f51f/"
style="text-decoration: none; font-size: 10px; margin: 0;"
>
<img src="https://pikwizard.com/pw/medium/72c8e68bbeb64313b0b5c28f8a66f51f.jpg" style="margin: 0; width: 100%;" alt="" />
<p style="font-size: 12px; margin: 0;">PikWizard</p>
</a>
</span>
</span>
Free (free of charge)
Free for personal and commercial use.
Author: Awesome Content
Similar Free Stock Images

Premium


Premium


Premium


Premium


Premium


Premium


Premium


Premium


Premium


Premium


Premium


Premium


Premium


Premium


Premium


Premium


Premium


Premium


Premium


Premium


Premium


Premium


Premium


Premium