- Home >
- Stock Photos >
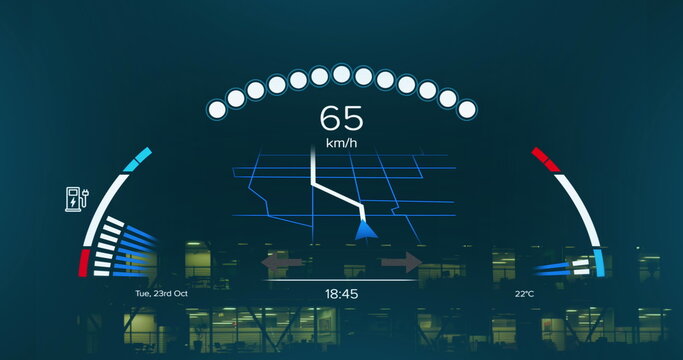
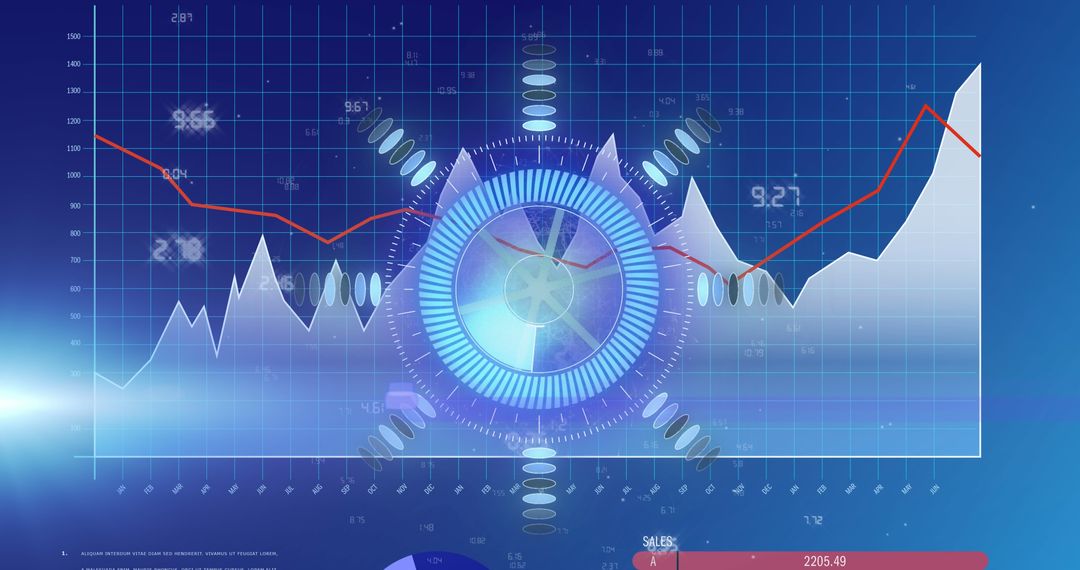
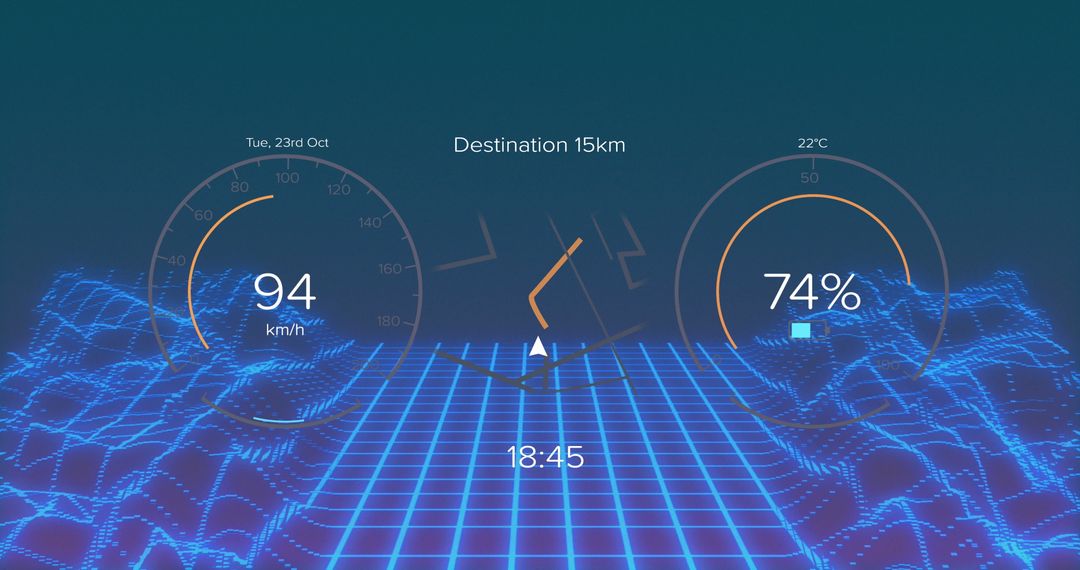
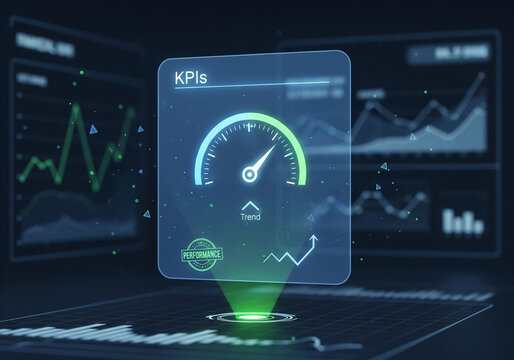
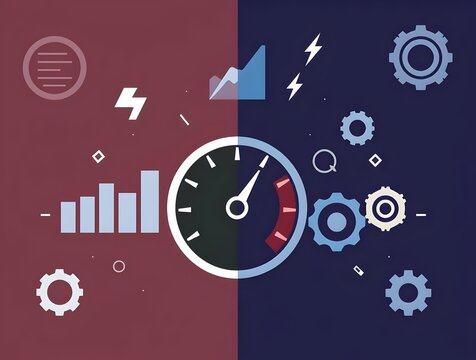
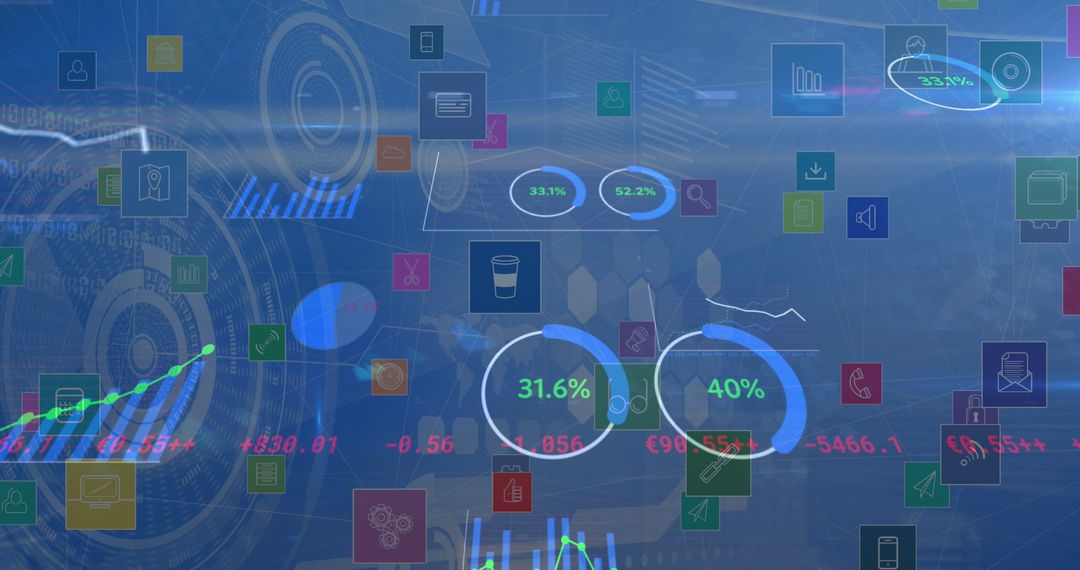
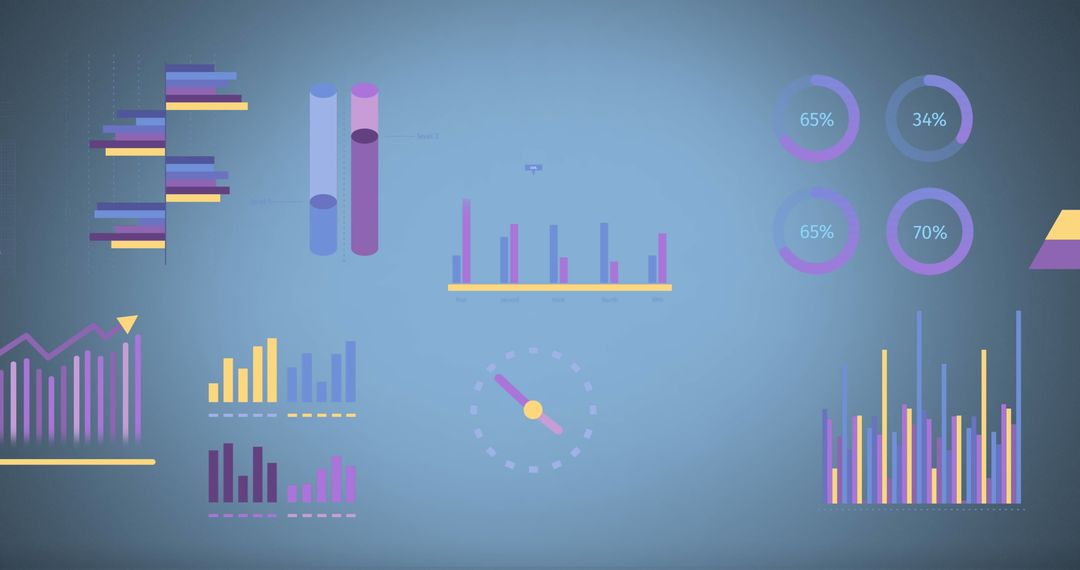
- Data Analytics with Speedometer Driving Business Innovation
Data Analytics with Speedometer Driving Business Innovation Image

Dynamic visualization of digital graphs with a speedometer motif against a blue backdrop signifies the interplay between technology and business analytics. Perfect for illustrating futuristic themes, digital transformation, in fields like automobile technology, financial tech solutions, or big data strategies.
Powered by 


2
downloads
downloads
Tags:
More
Credit Photo
If you would like to credit the Photo, here are some ways you can do so
Text Link
photo Link
<span class="text-link">
<span>
<a target="_blank" href=https://pikwizard.com/photo/data-analytics-with-speedometer-driving-business-innovation/9593a88757de838cc7b342f8bf5bfc15/>PikWizard</a>
</span>
</span>
<span class="image-link">
<span
style="margin: 0 0 20px 0; display: inline-block; vertical-align: middle; width: 100%;"
>
<a
target="_blank"
href="https://pikwizard.com/photo/data-analytics-with-speedometer-driving-business-innovation/9593a88757de838cc7b342f8bf5bfc15/"
style="text-decoration: none; font-size: 10px; margin: 0;"
>
<img src="https://pikwizard.com/pw/medium/9593a88757de838cc7b342f8bf5bfc15.jpg" style="margin: 0; width: 100%;" alt="" />
<p style="font-size: 12px; margin: 0;">PikWizard</p>
</a>
</span>
</span>
Free (free of charge)
Free for personal and commercial use.
Author: Authentic Images
Similar Free Stock Images

Premium


Premium


Premium


Premium


Premium


Premium


Premium


Premium


Premium


Premium


Premium


Premium


Premium


Premium


Premium


Premium


Premium


Premium


Premium


Premium


Premium


Premium


Premium


Premium