- Home >
- Stock Photos >
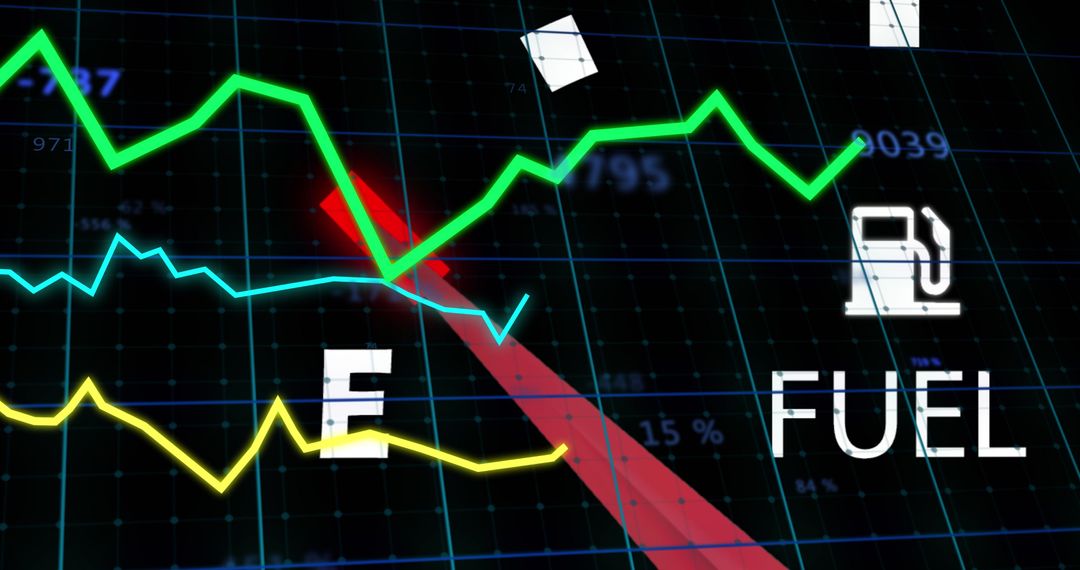
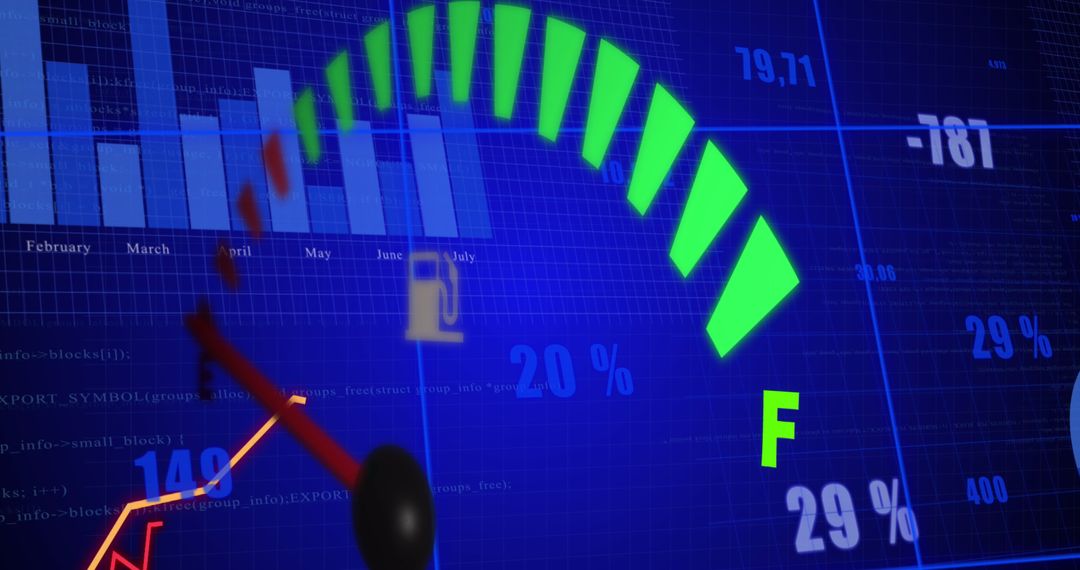
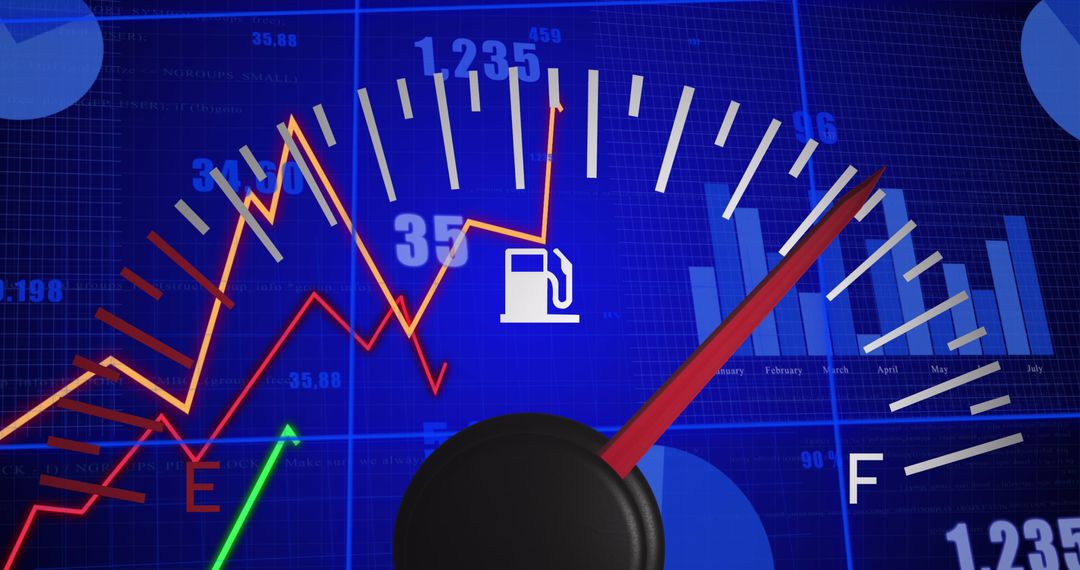
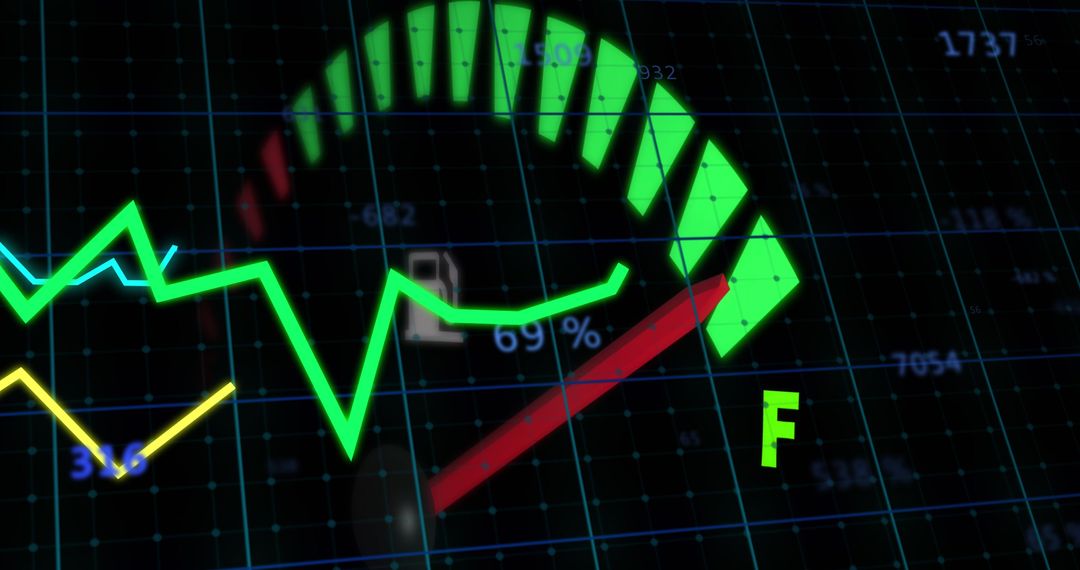
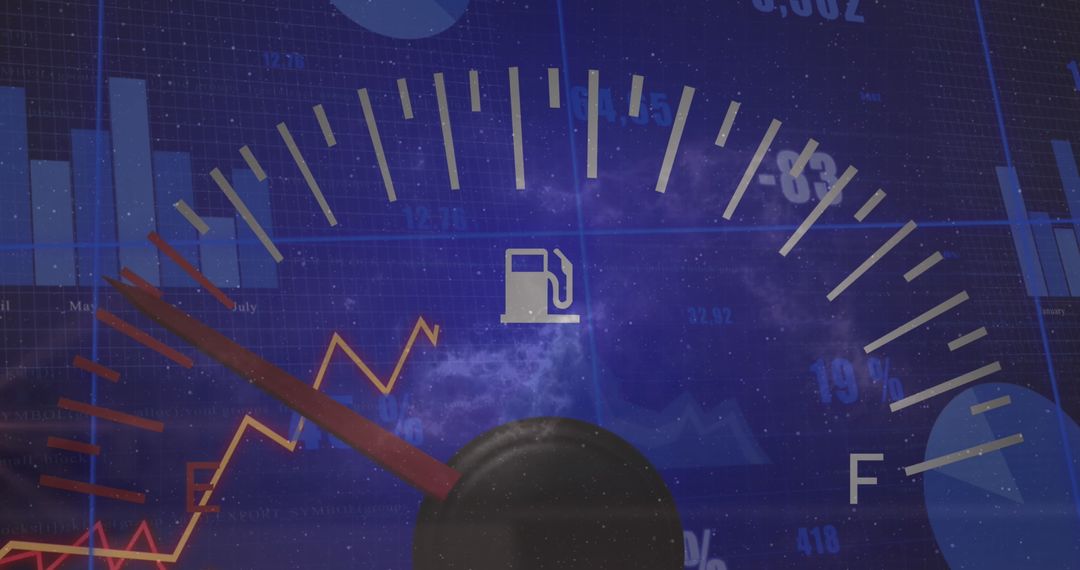
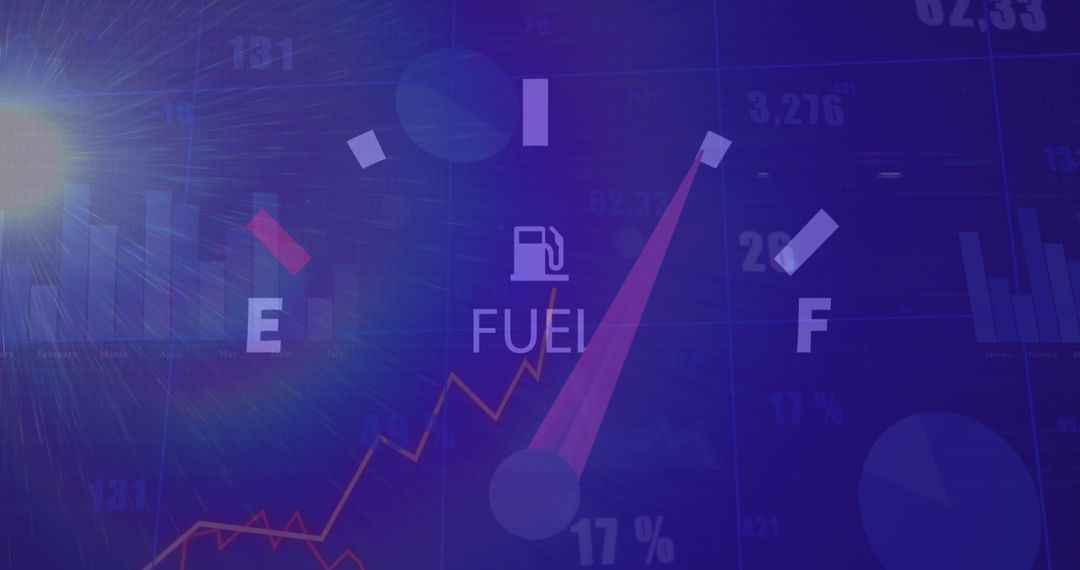
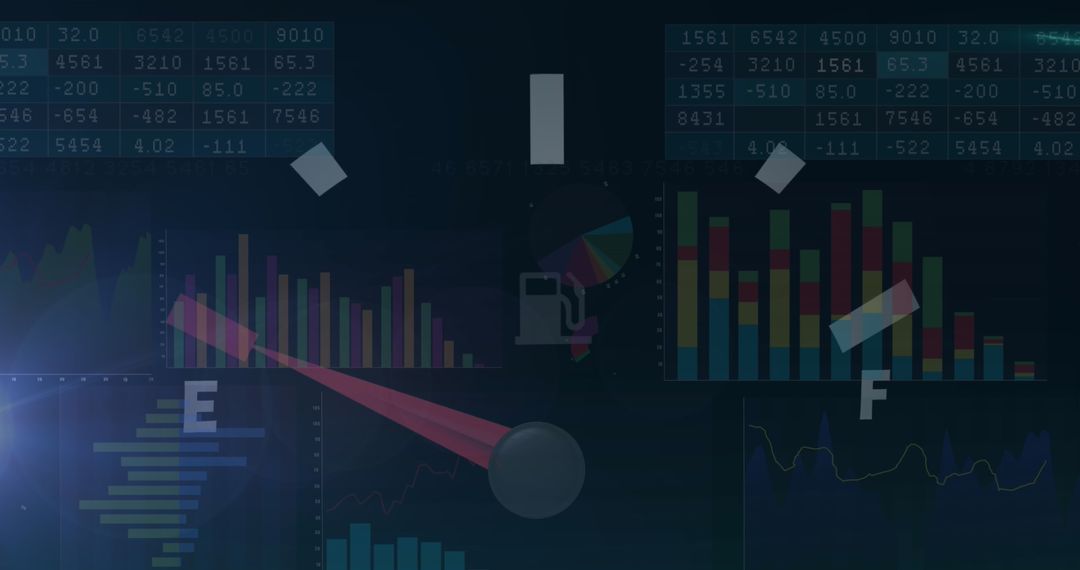
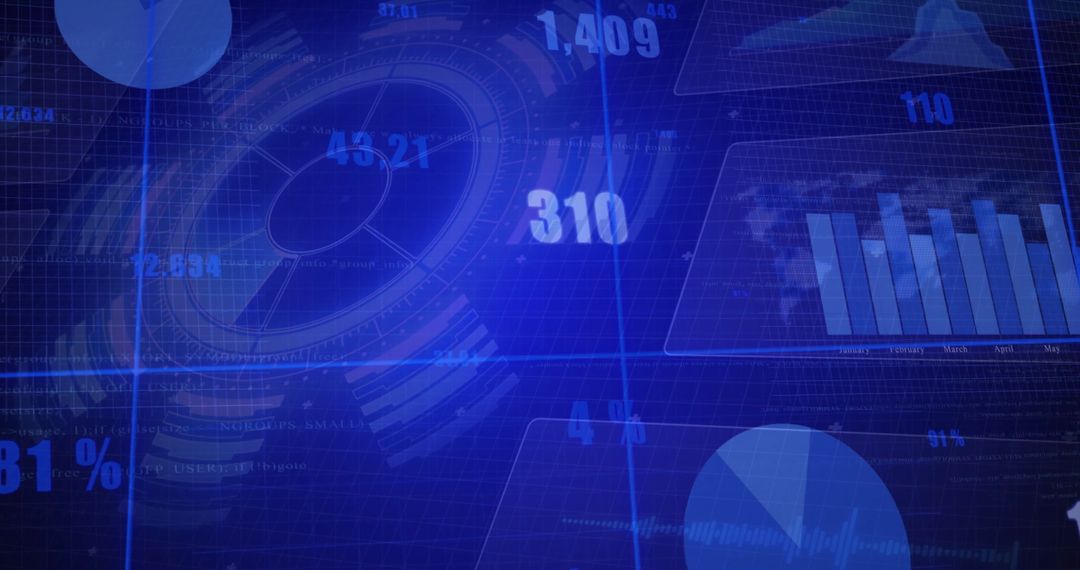
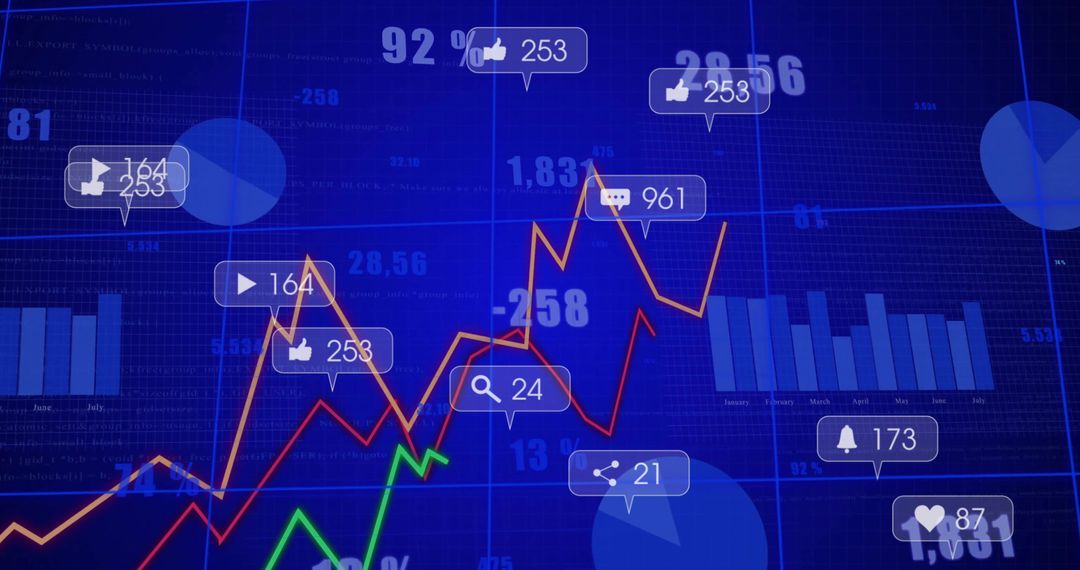
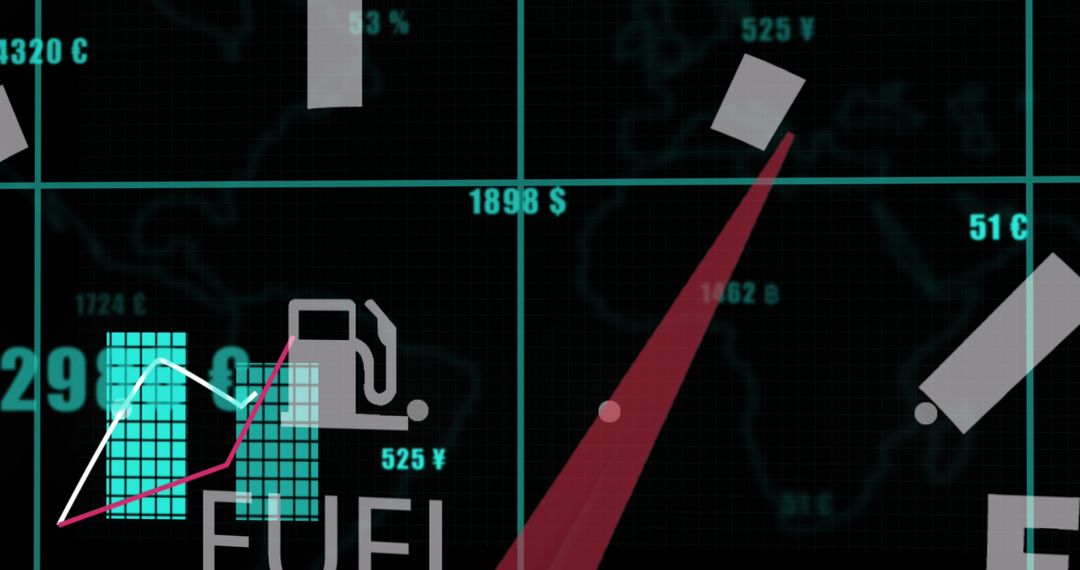
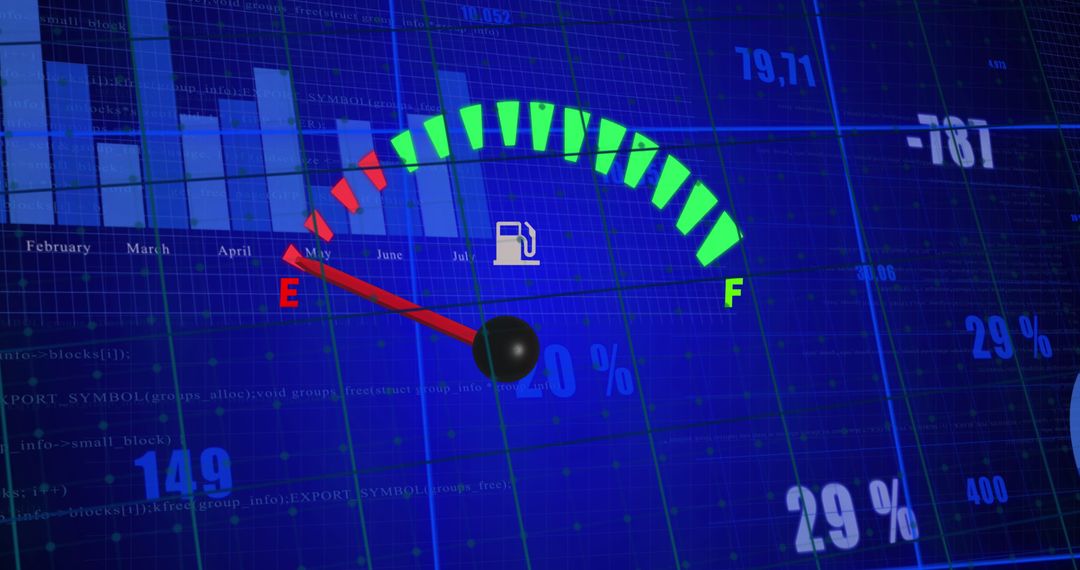
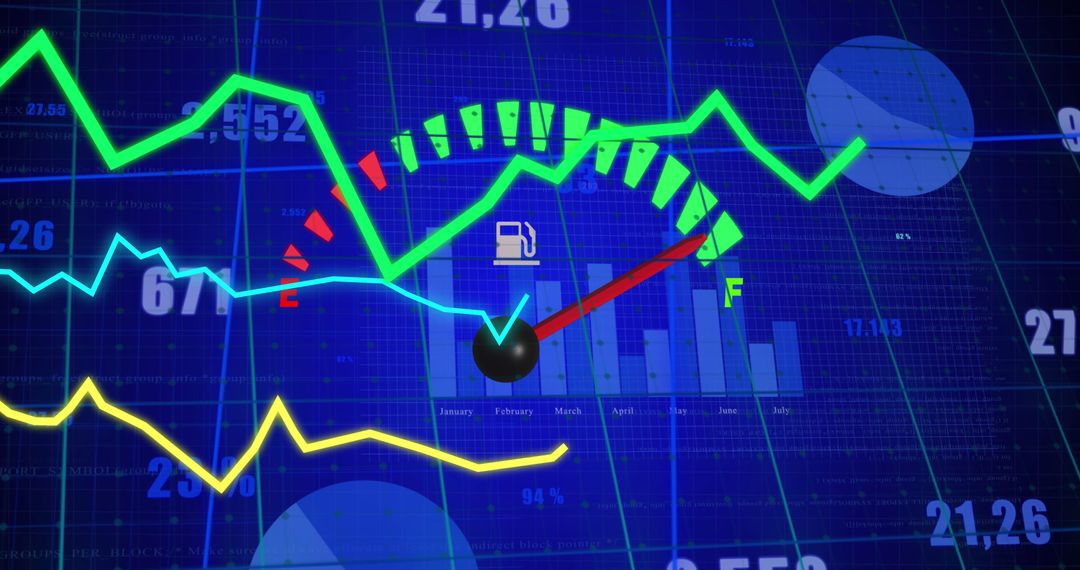
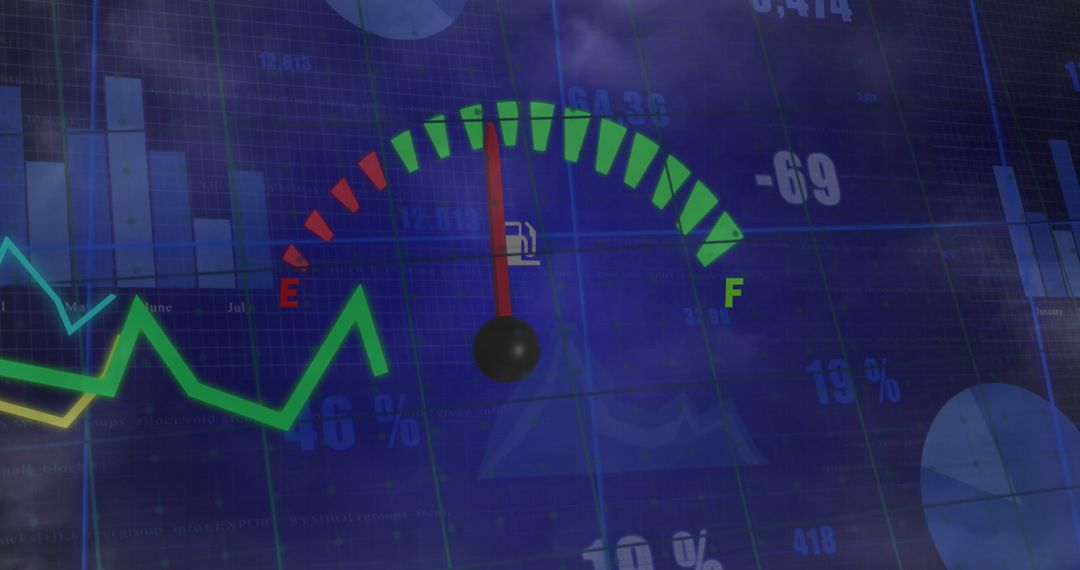
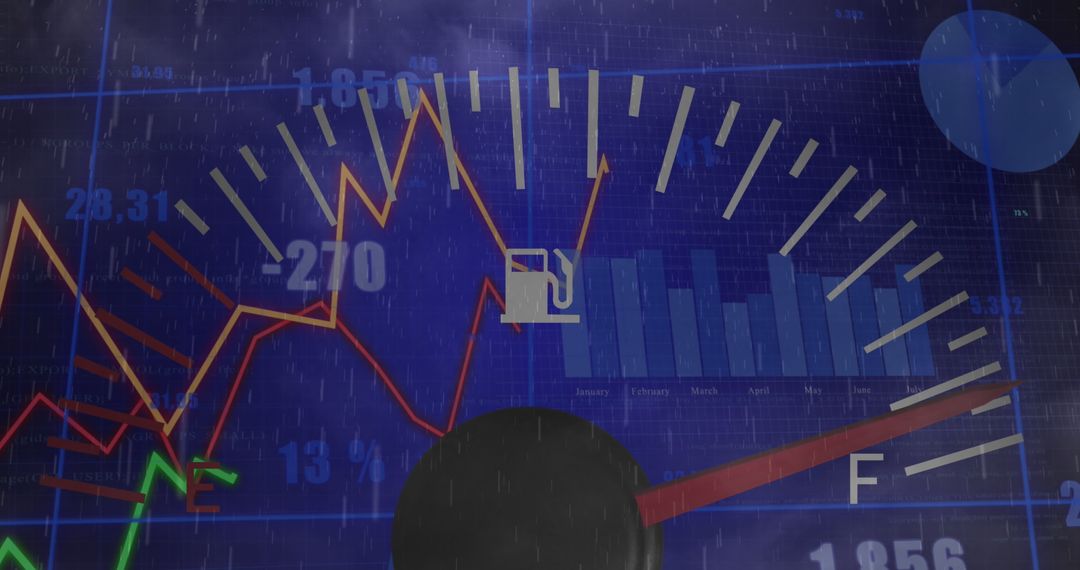
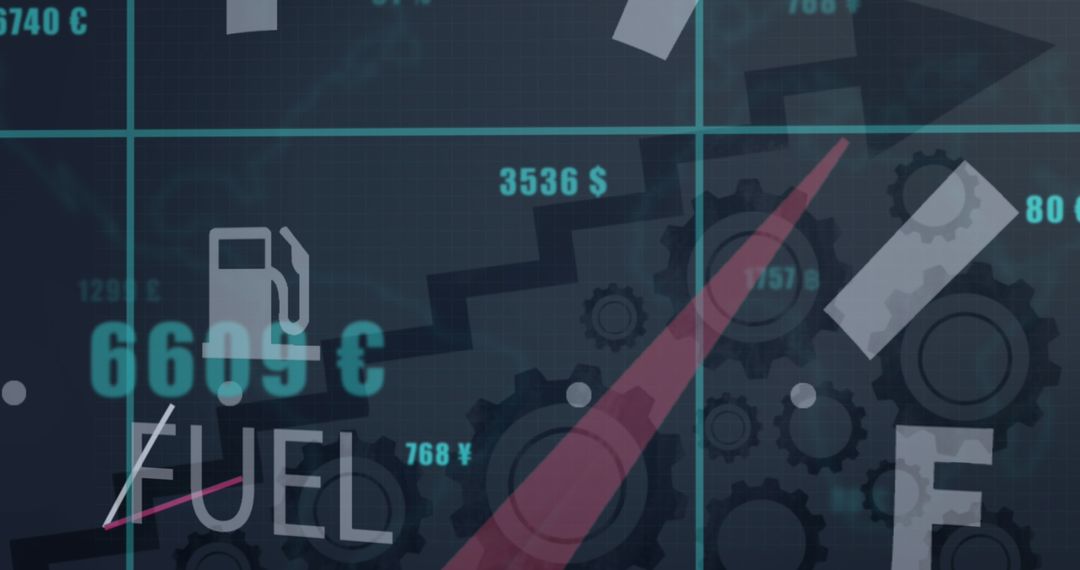
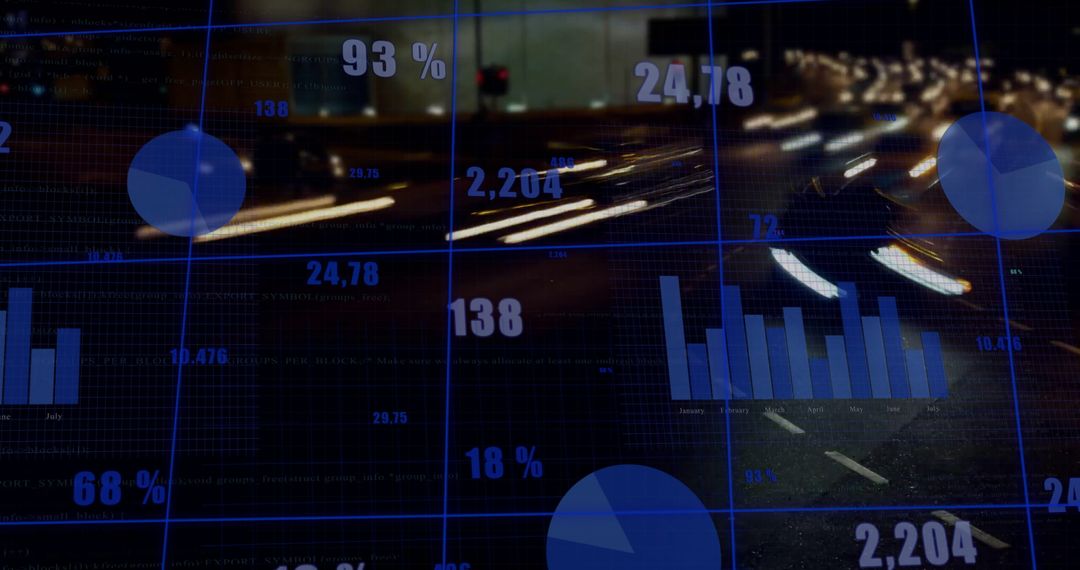
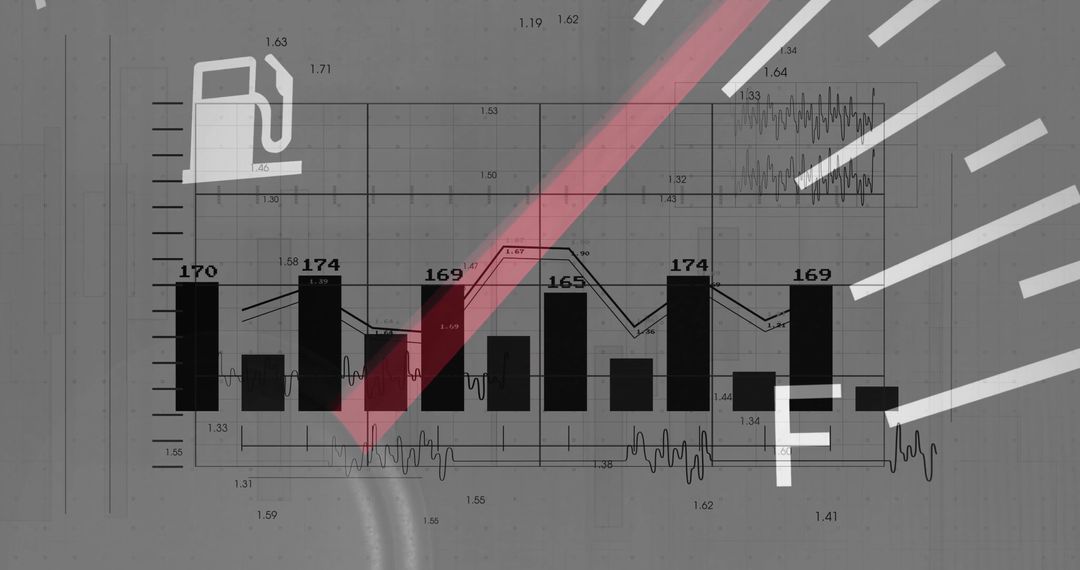
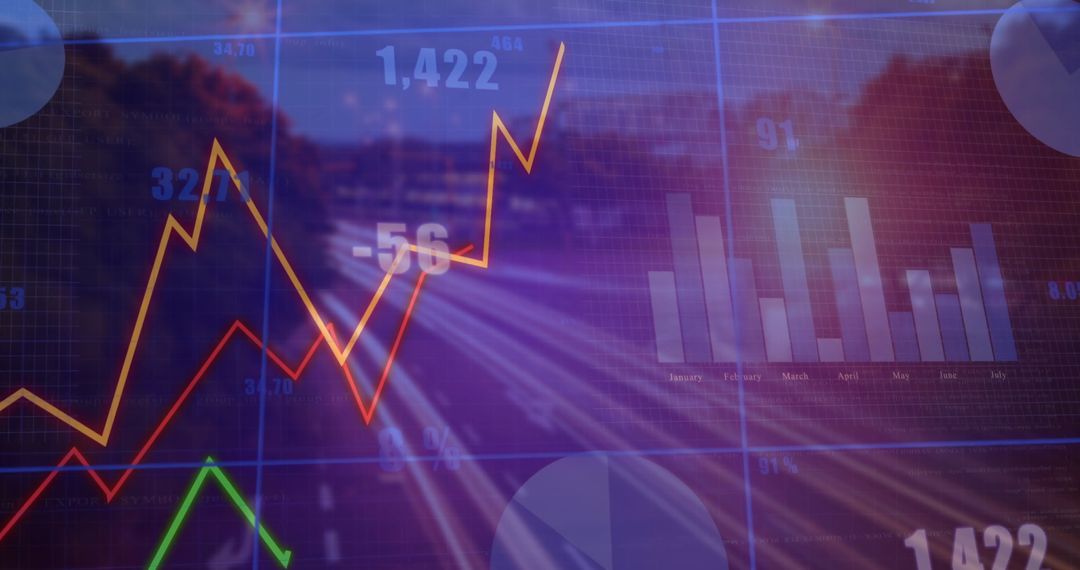
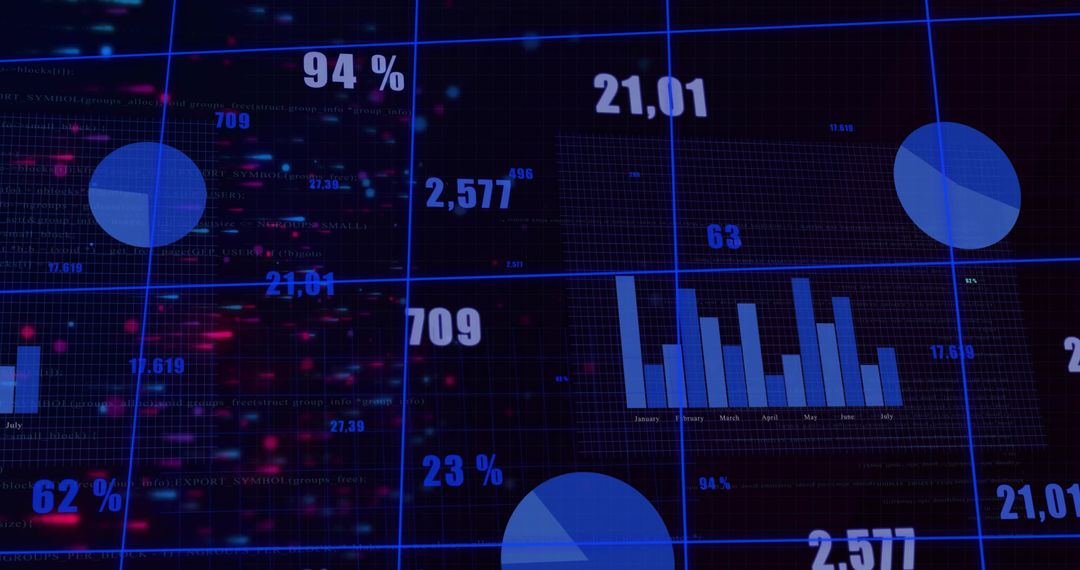
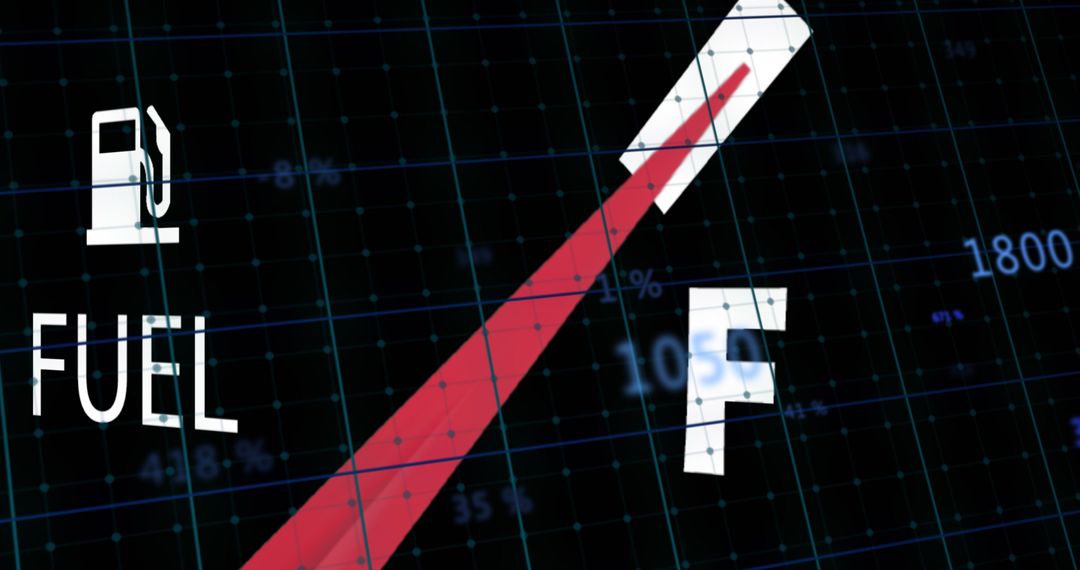
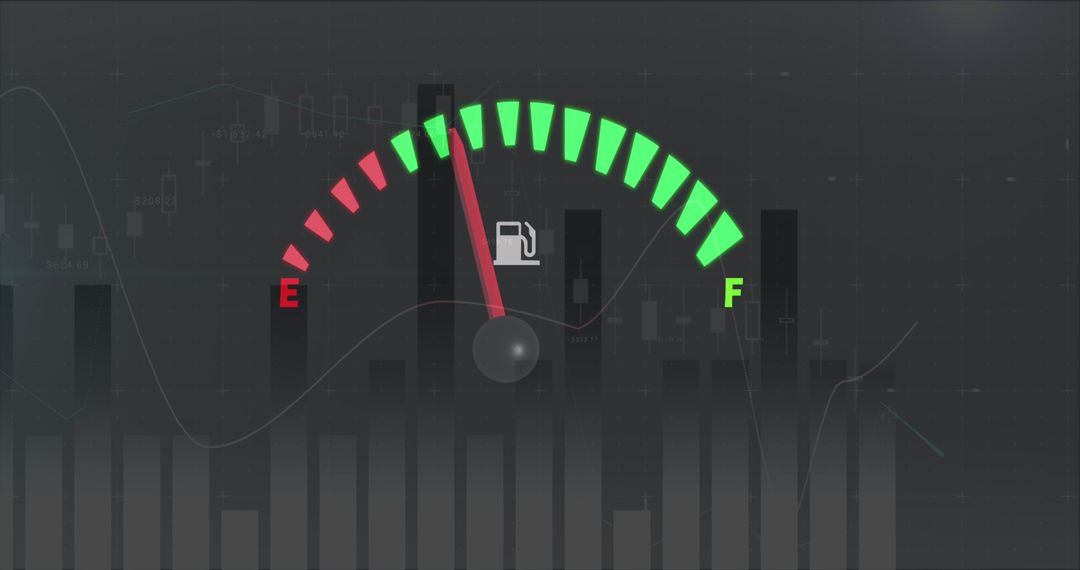
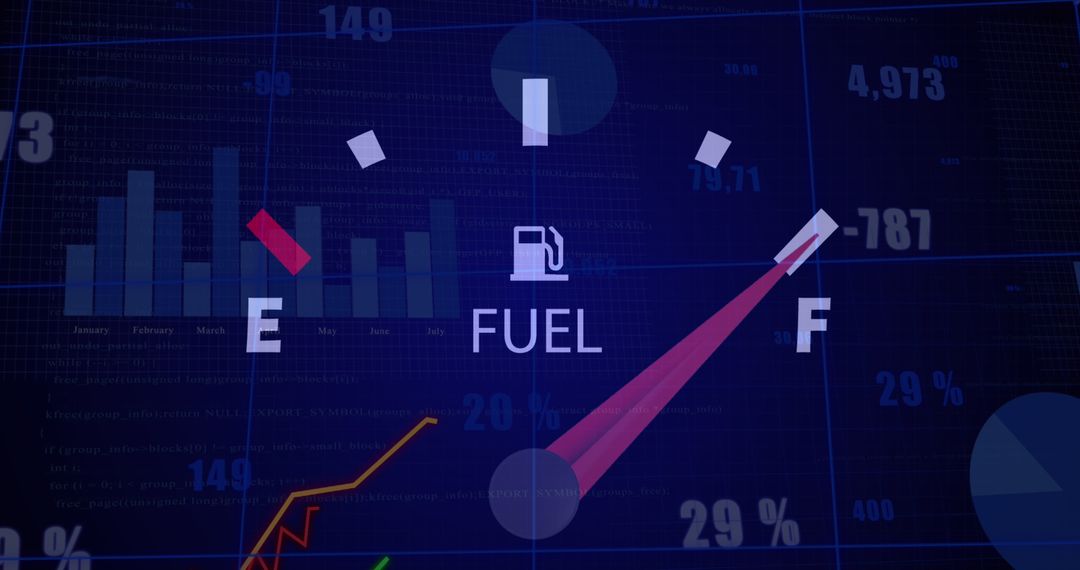
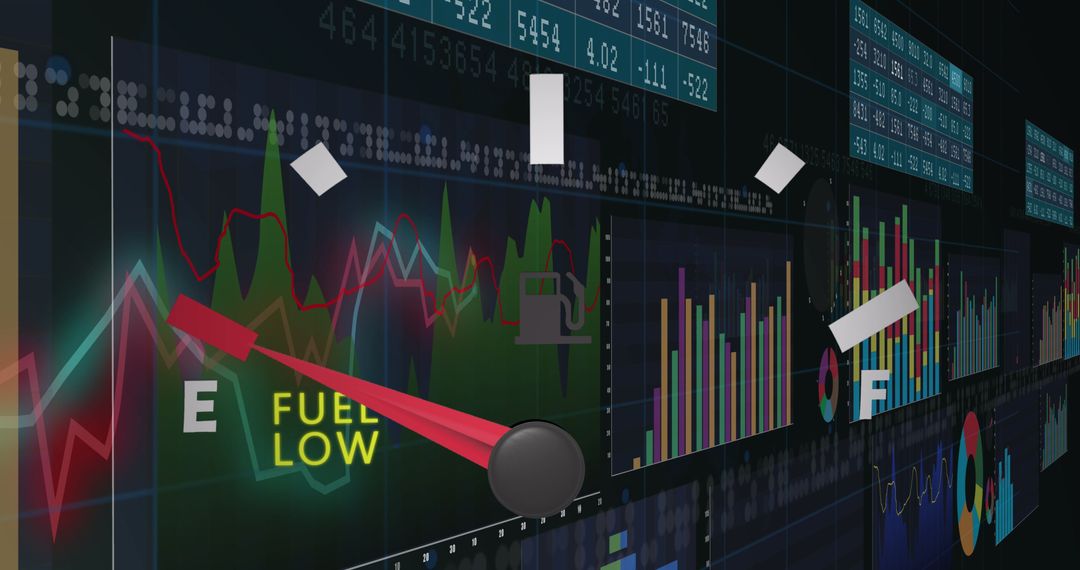
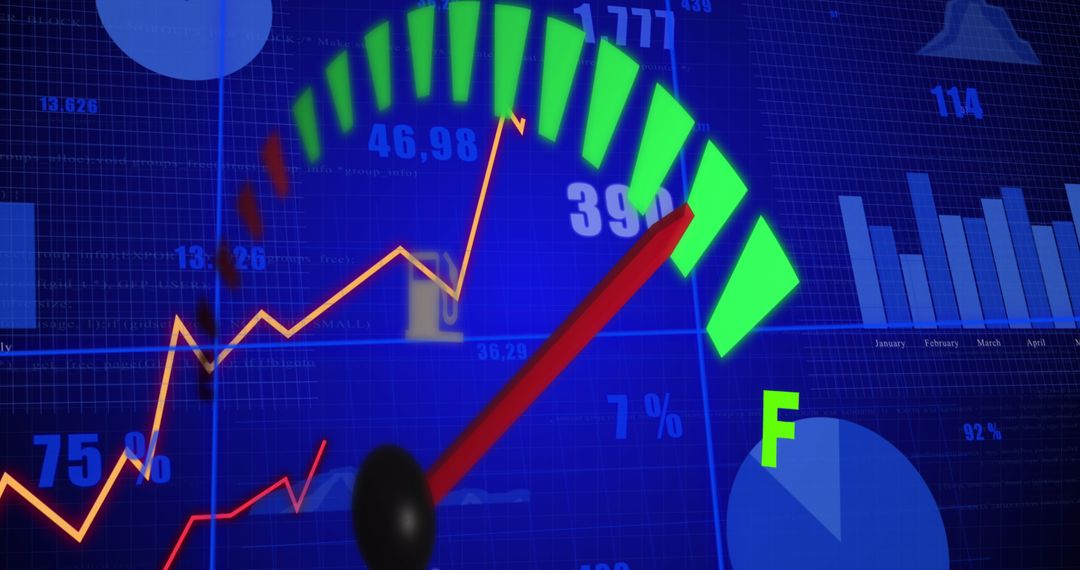
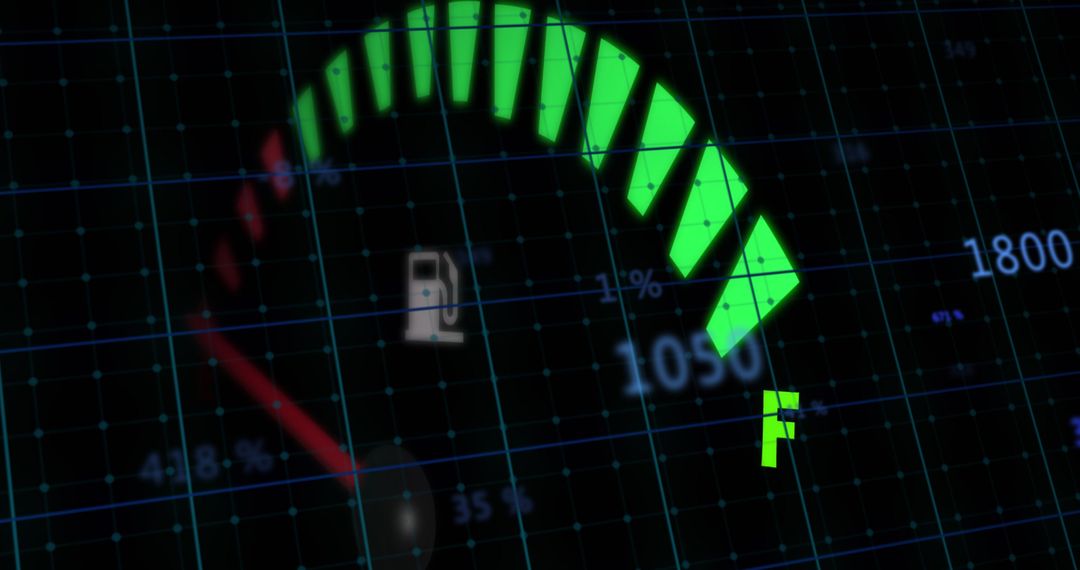
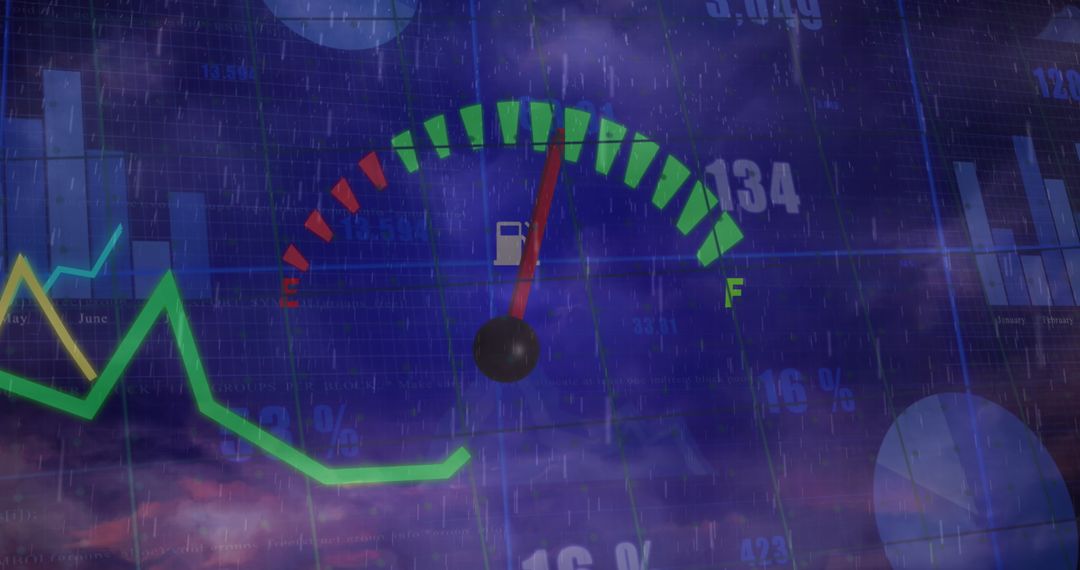
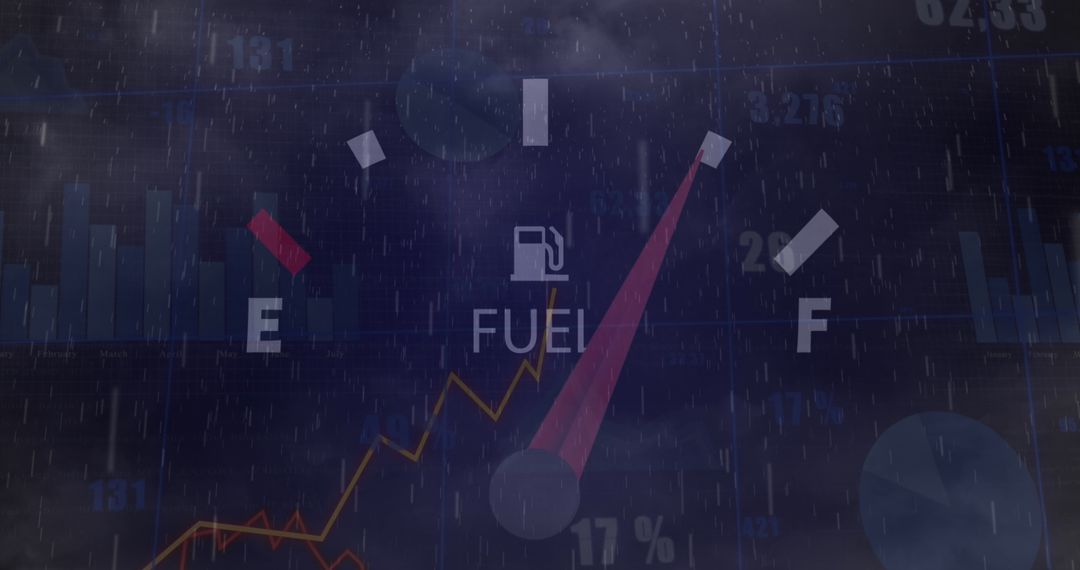
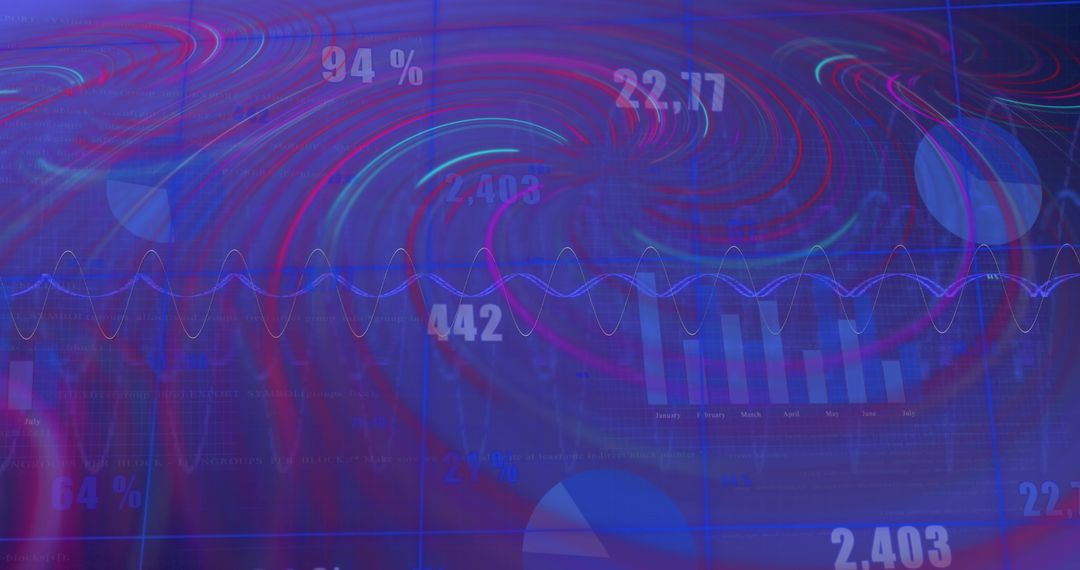
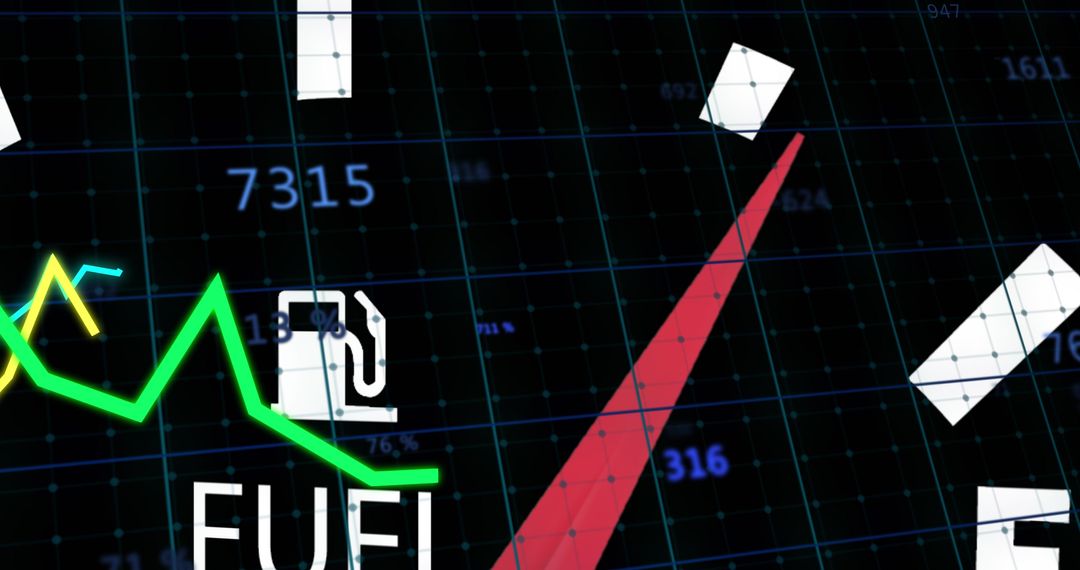
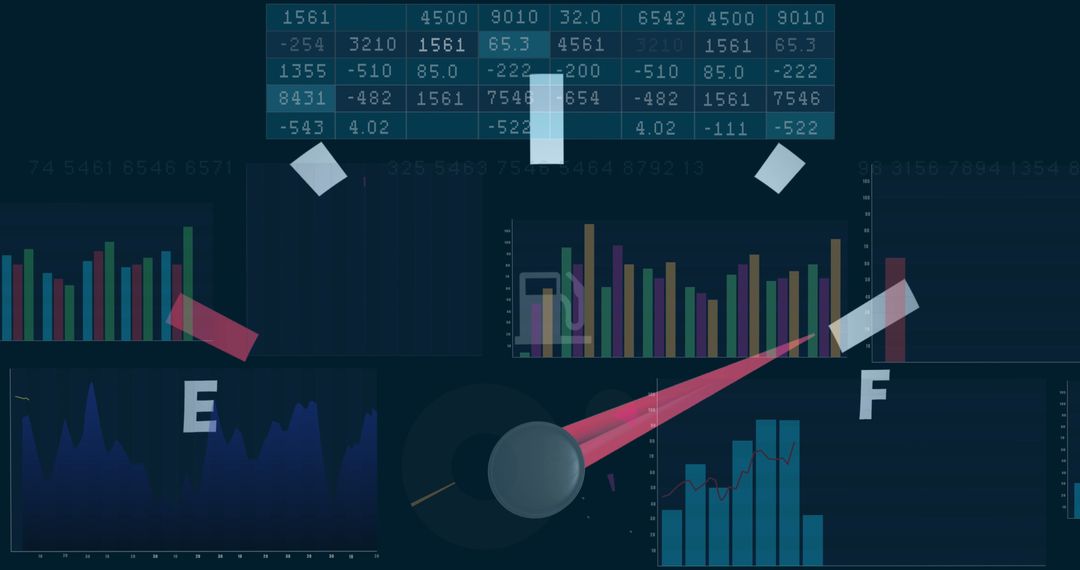
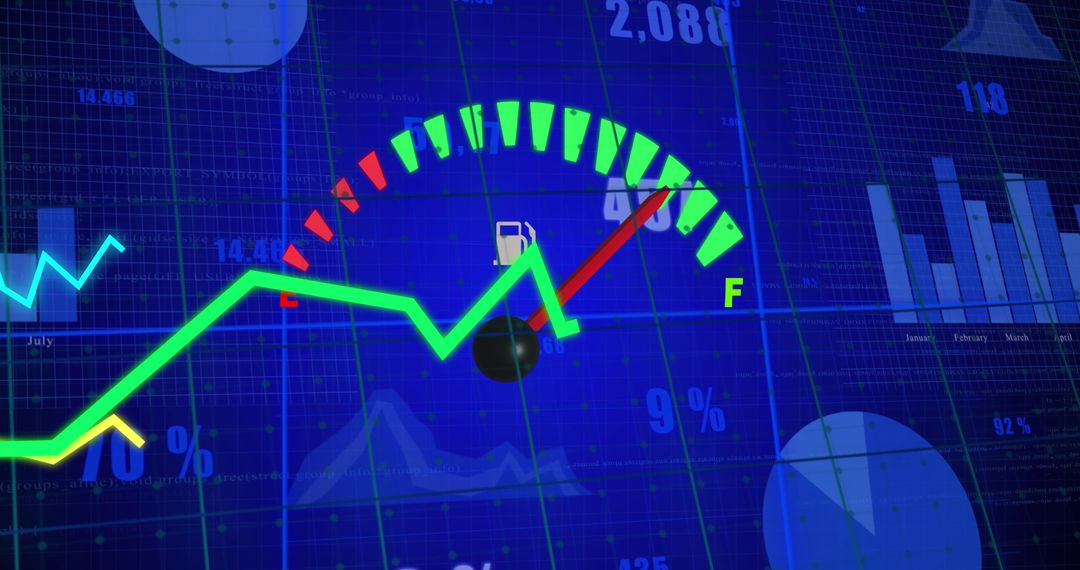
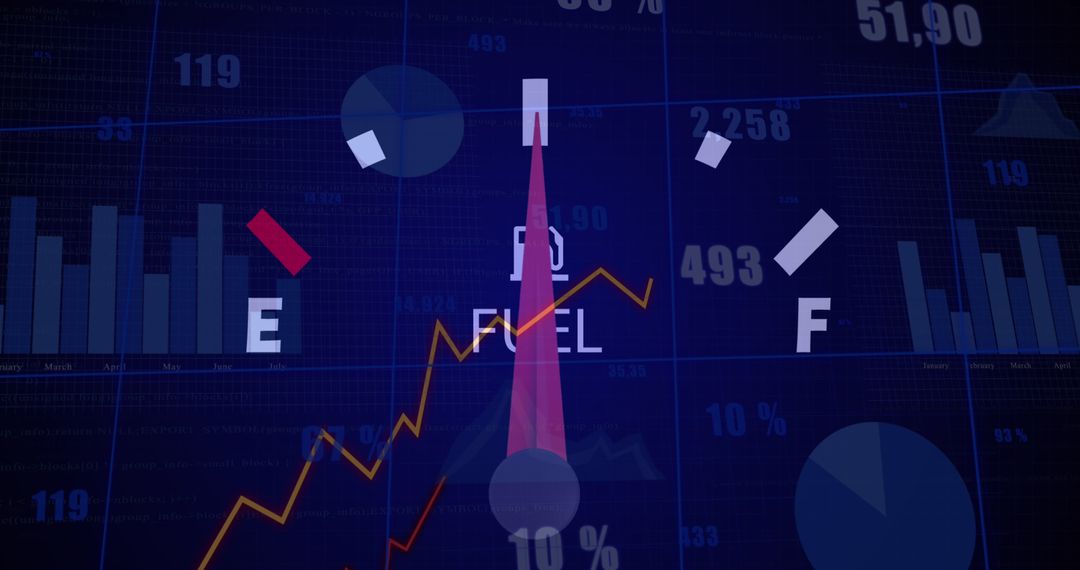
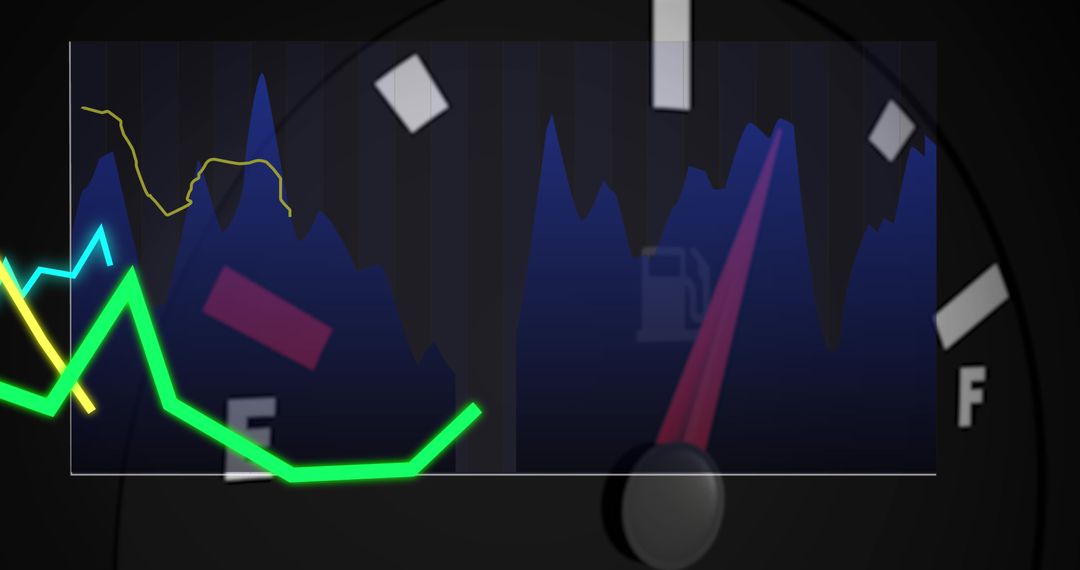
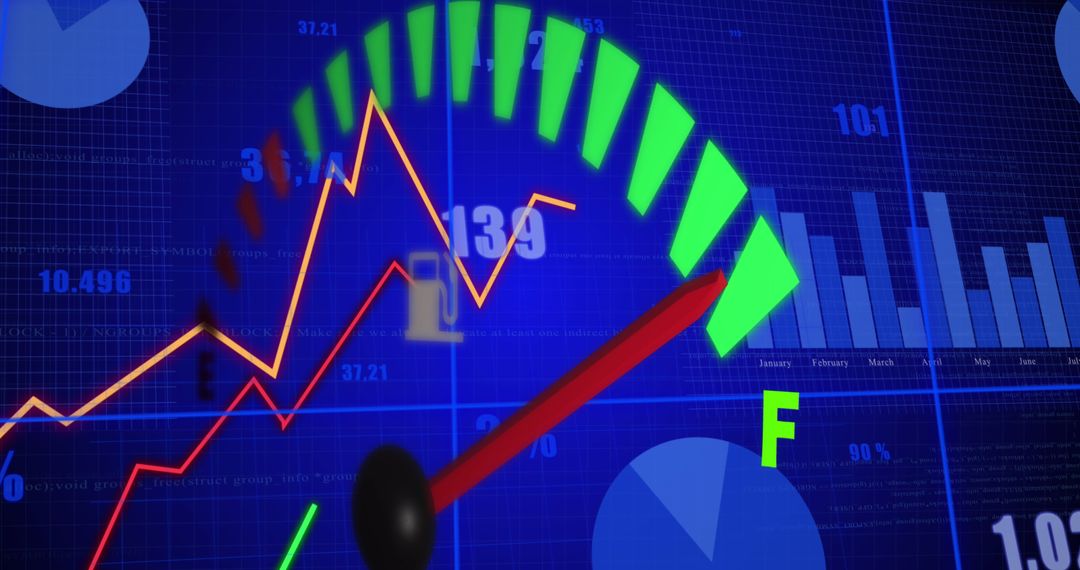
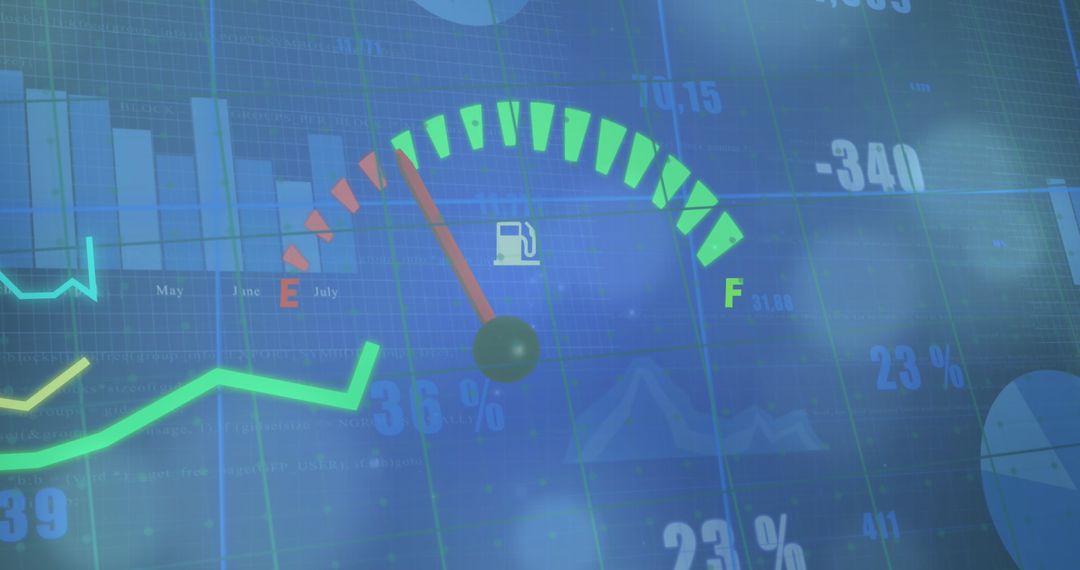
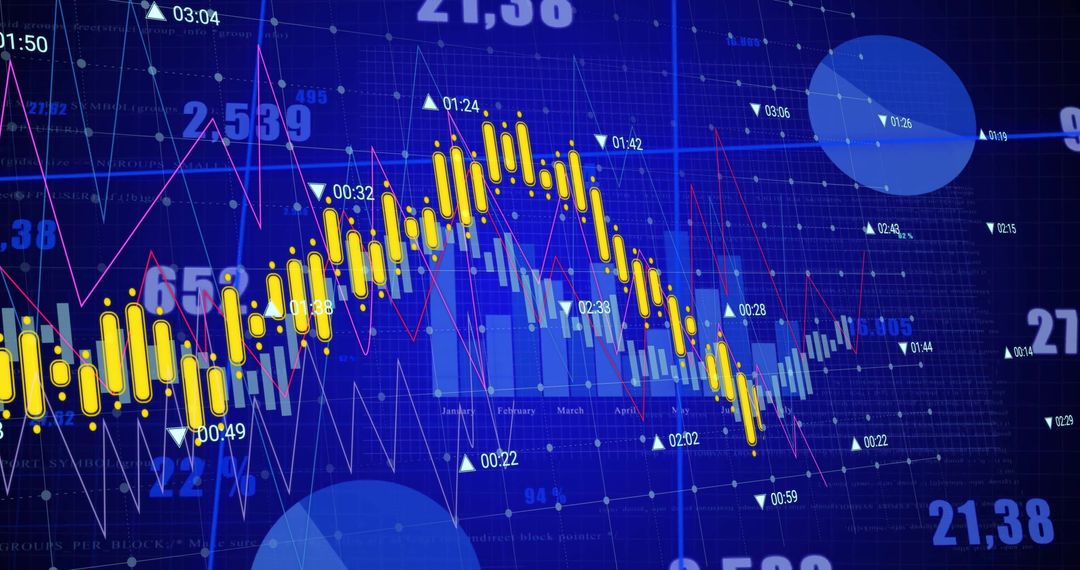
- Data Integration with Enhanced Fuel Indicators
Data Integration with Enhanced Fuel Indicators Image
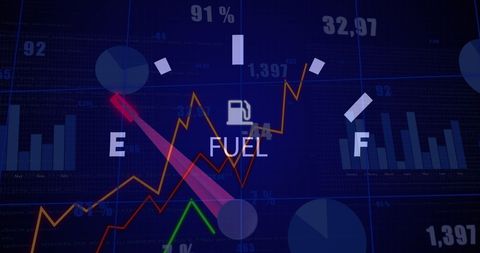
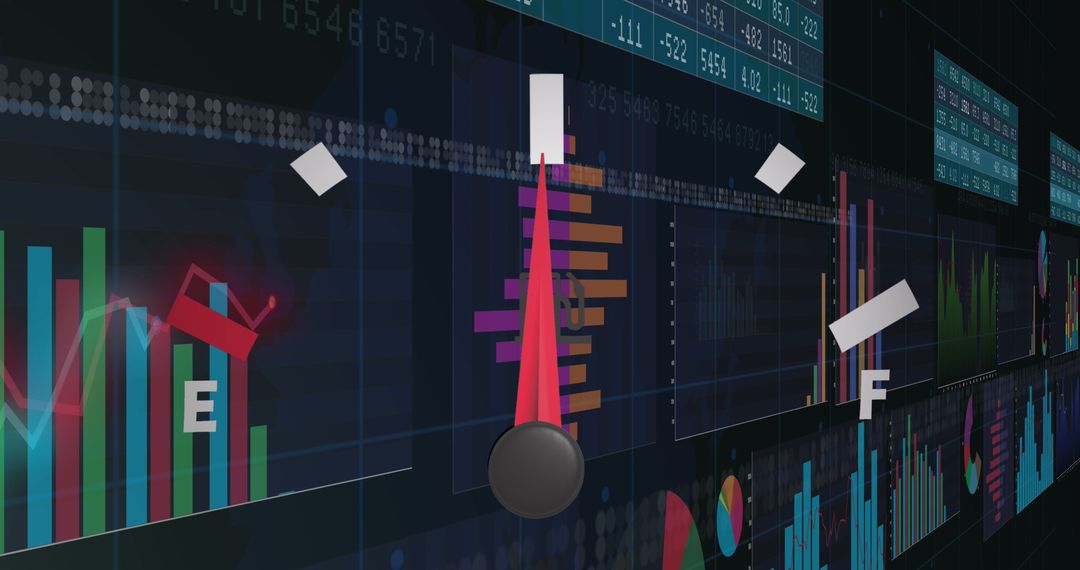
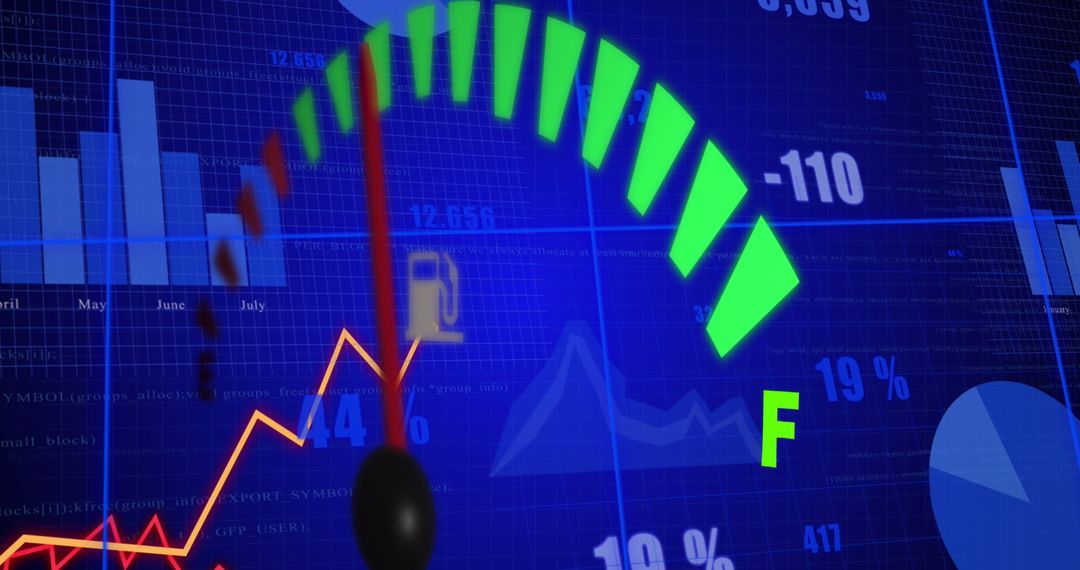
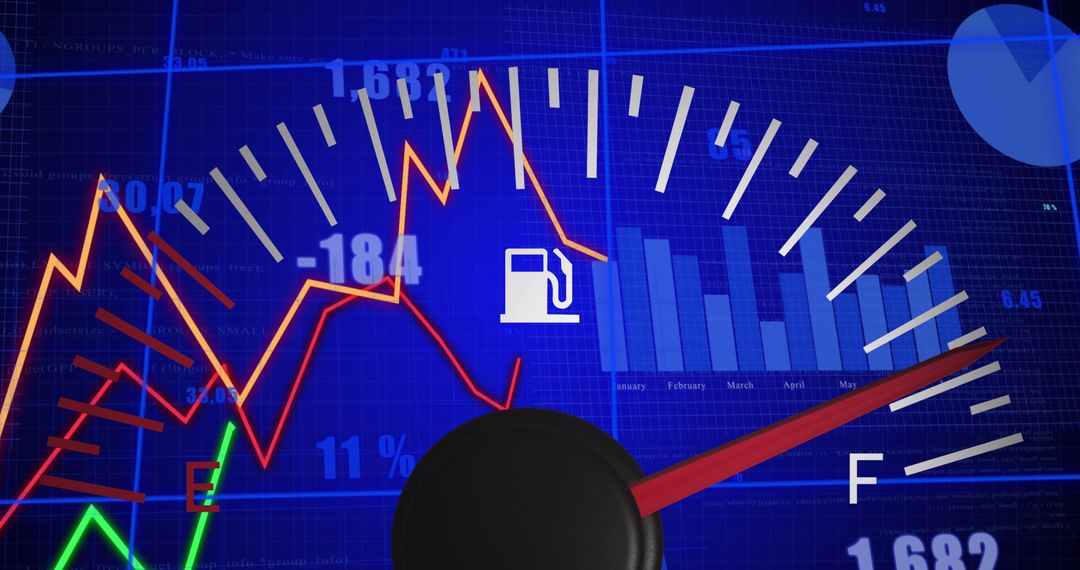
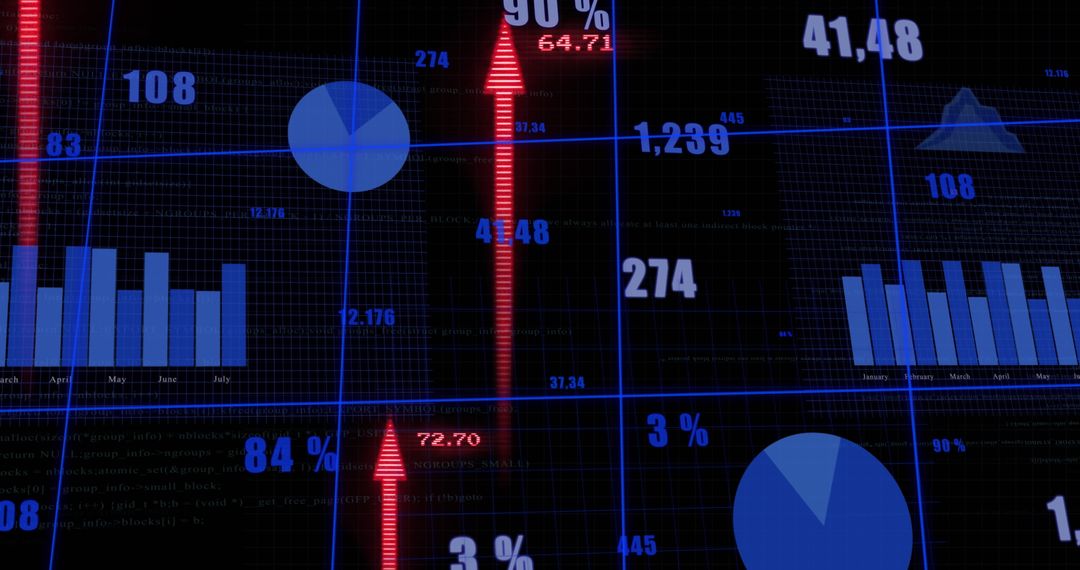
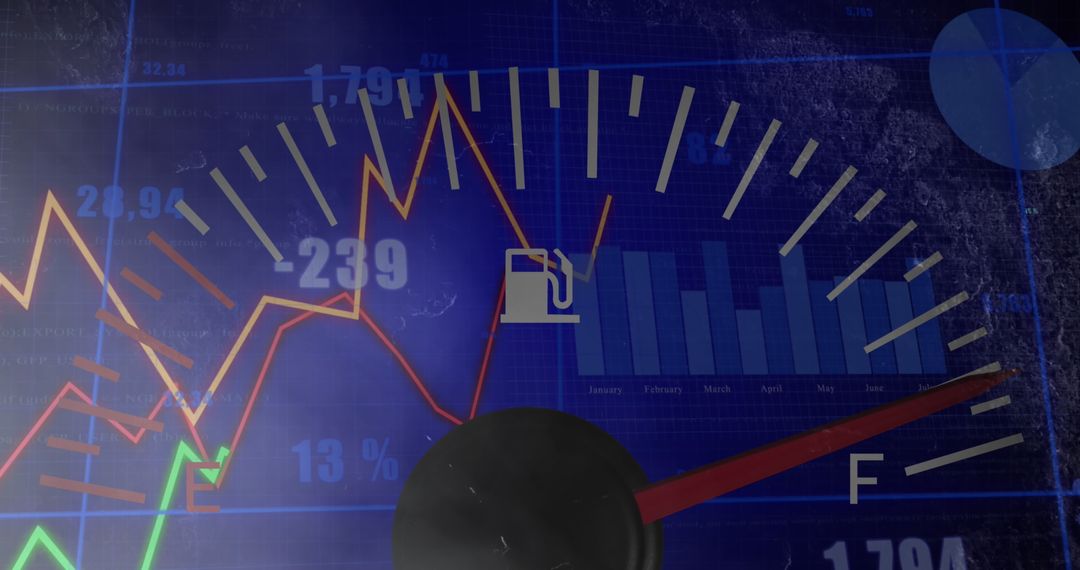
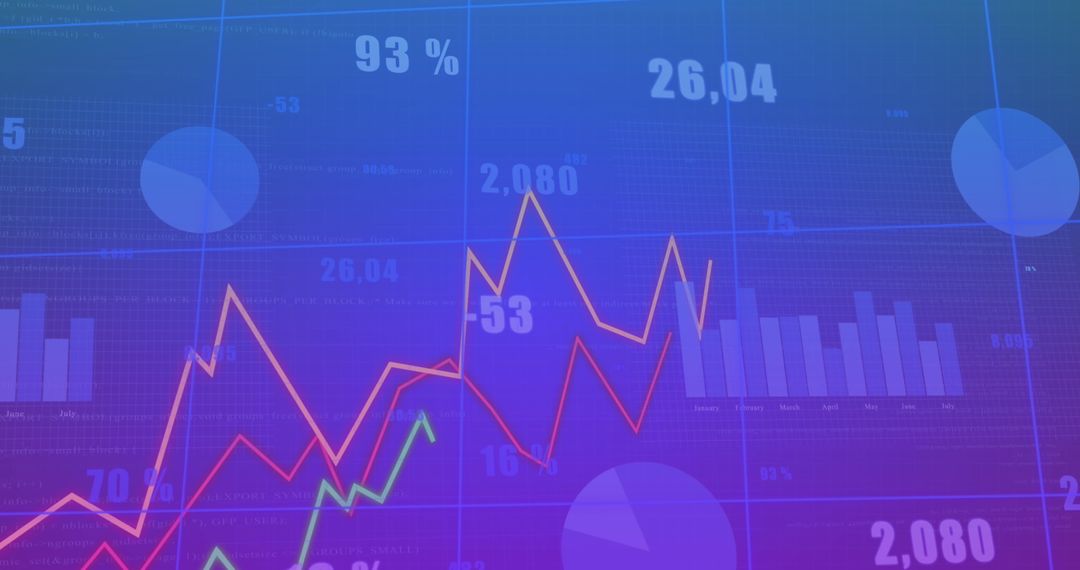
This image creatively combines data processing elements such as graphs and analytics with a car's fuel gauge. The overlay of digital interfaces signifies integration of technology in automotive tech and finance monitoring. Suitable for illustrating articles on global business and technological advancements, or digital transformation in automotive sector.
Powered by  - Get 15% off with code: PIKWIZARD15


2
downloads
downloads
Tags:
More
Credit Photo
If you would like to credit the Photo, here are some ways you can do so
Text Link
photo Link
<span class="text-link">
<span>
<a target="_blank" href=https://pikwizard.com/photo/data-integration-with-enhanced-fuel-indicators/5d4919f1549a34c5e0e0cba69369f173/>PikWizard</a>
</span>
</span>
<span class="image-link">
<span
style="margin: 0 0 20px 0; display: inline-block; vertical-align: middle; width: 100%;"
>
<a
target="_blank"
href="https://pikwizard.com/photo/data-integration-with-enhanced-fuel-indicators/5d4919f1549a34c5e0e0cba69369f173/"
style="text-decoration: none; font-size: 10px; margin: 0;"
>
<img src="https://pikwizard.com/pw/medium/5d4919f1549a34c5e0e0cba69369f173.jpg" style="margin: 0; width: 100%;" alt="" />
<p style="font-size: 12px; margin: 0;">PikWizard</p>
</a>
</span>
</span>
Free (free of charge)
Free for personal and commercial use.
Author: People Creations
Similar Free Stock Images