
- Home >
- Stock Photos >
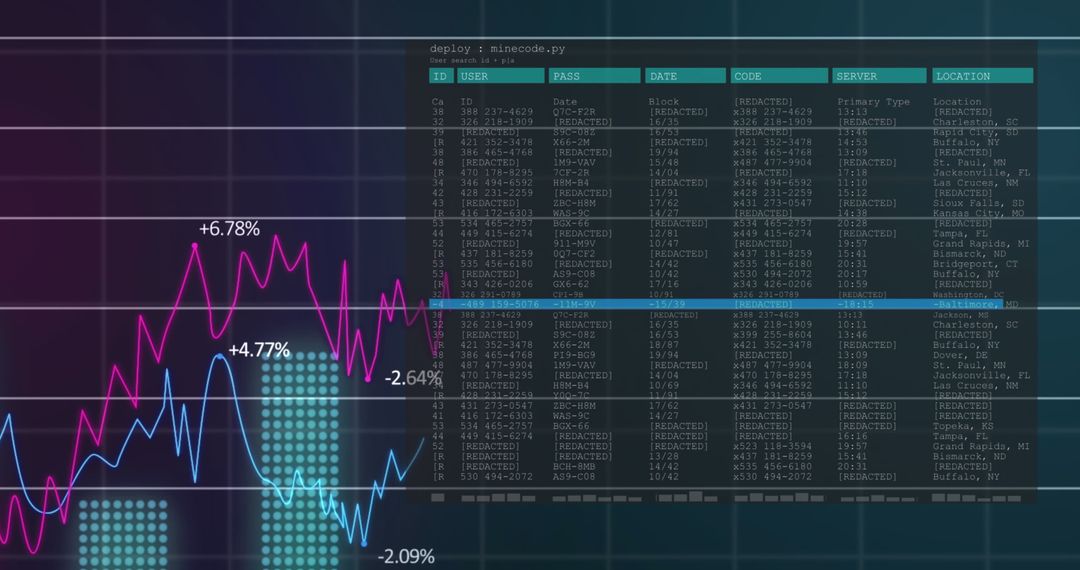
- Data Terminal Dashboard with Candlestick Charts, Line Plots and Trading Analytics Overlay
Data Terminal Dashboard with Candlestick Charts, Line Plots and Trading Analytics Overlay Image

Displaying dark data terminal with candlestick bars, colored line plots, percentage annotations, and faint workstation silhouette. Featuring layered code-style grids and neon color accents for high-tech feel. Suiting finance websites, trading platforms, fintech presentations, investment reports, market analysis blogs, and social media promotions. Serving as hero banner, background for dashboard mockups, slide visuals for investor pitches, header for analytics articles, or thumbnail for trading tutorials. Offering strong visual emphasis on market trends, volatility, and performance metrics. Including transparent center area for overlaying text or UI elements.
Powered by 


0
downloads
downloads
Tags:
More
Credit Photo
If you would like to credit the Photo, here are some ways you can do so
Text Link
photo Link
<span class="text-link">
<span>
<a target="_blank" href=https://pikwizard.com/photo/data-terminal-dashboard-with-candlestick-charts-line-plots-and-trading-analytics-overlay/fbf3b0ef02b4f7679ad1b7f0964ca112/>PikWizard</a>
</span>
</span>
<span class="image-link">
<span
style="margin: 0 0 20px 0; display: inline-block; vertical-align: middle; width: 100%;"
>
<a
target="_blank"
href="https://pikwizard.com/photo/data-terminal-dashboard-with-candlestick-charts-line-plots-and-trading-analytics-overlay/fbf3b0ef02b4f7679ad1b7f0964ca112/"
style="text-decoration: none; font-size: 10px; margin: 0;"
>
<img src="https://pikwizard.com/pw/medium/fbf3b0ef02b4f7679ad1b7f0964ca112.jpg" style="margin: 0; width: 100%;" alt="" />
<p style="font-size: 12px; margin: 0;">PikWizard</p>
</a>
</span>
</span>
Free (free of charge)
Free for personal and commercial use.
Author: Authentic Images
Similar Free Stock Images

Premium


Premium


Premium


Premium


Premium


Premium


Premium


Premium


Premium


Premium


Premium


Premium


Premium


Premium


Premium


Premium


Premium


Premium


Premium


Premium


Premium


Premium


Premium


Premium

