- Home >
- Stock Photos >
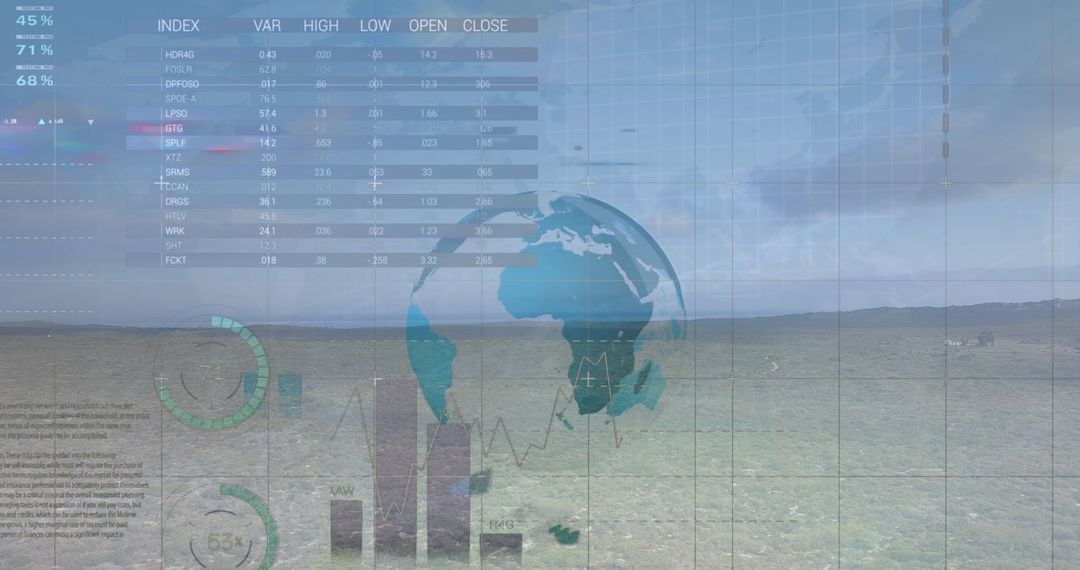
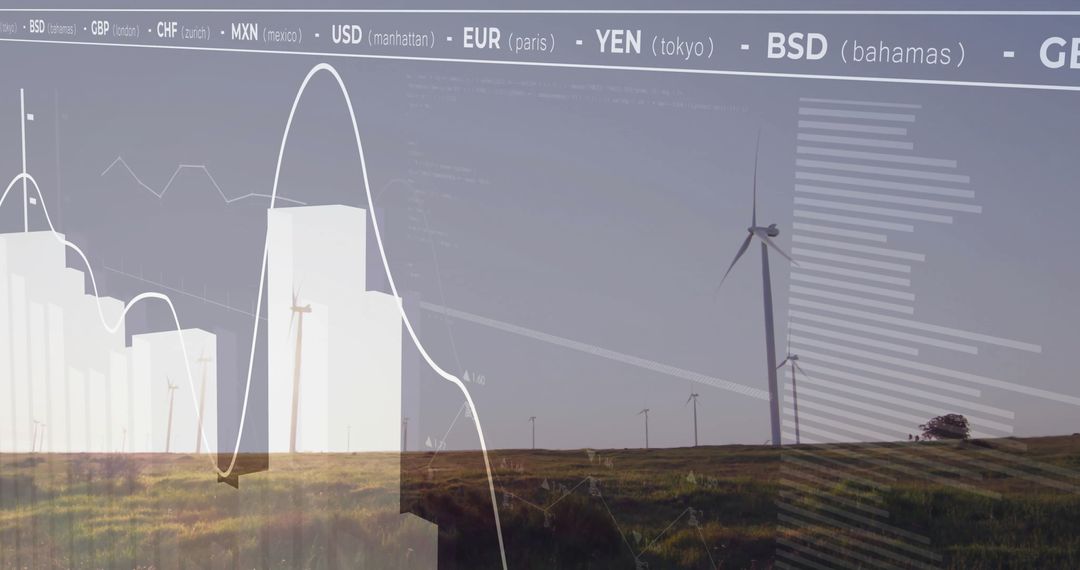
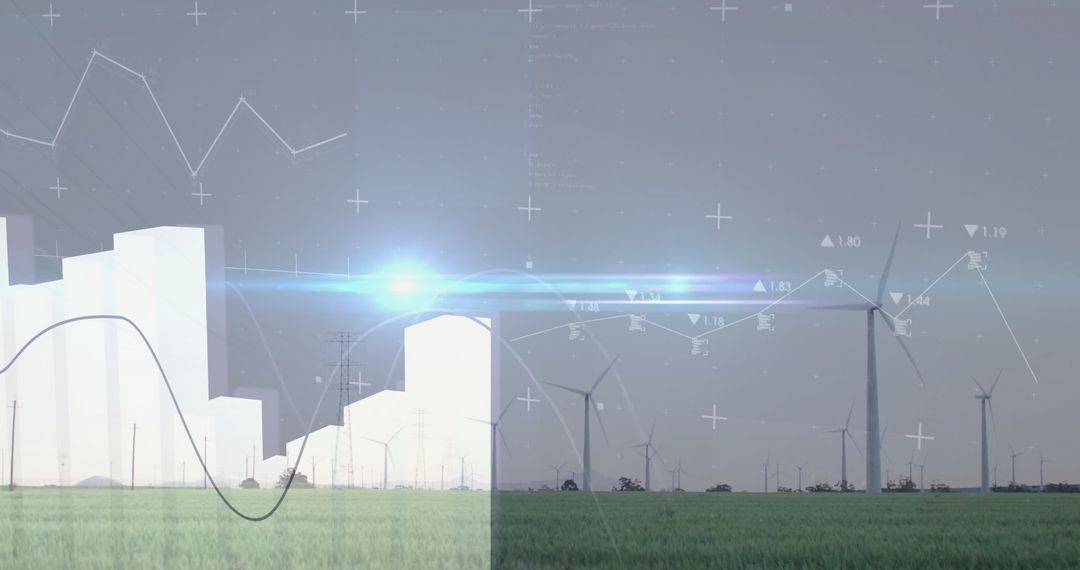
- Data Visualization Combines Nature and Finance Concepts
Data Visualization Combines Nature and Finance Concepts Image
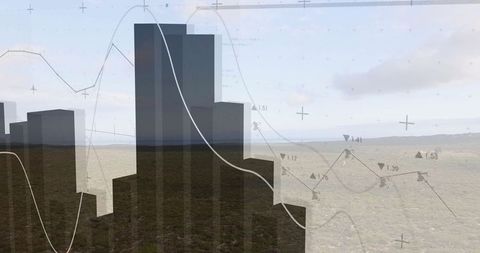
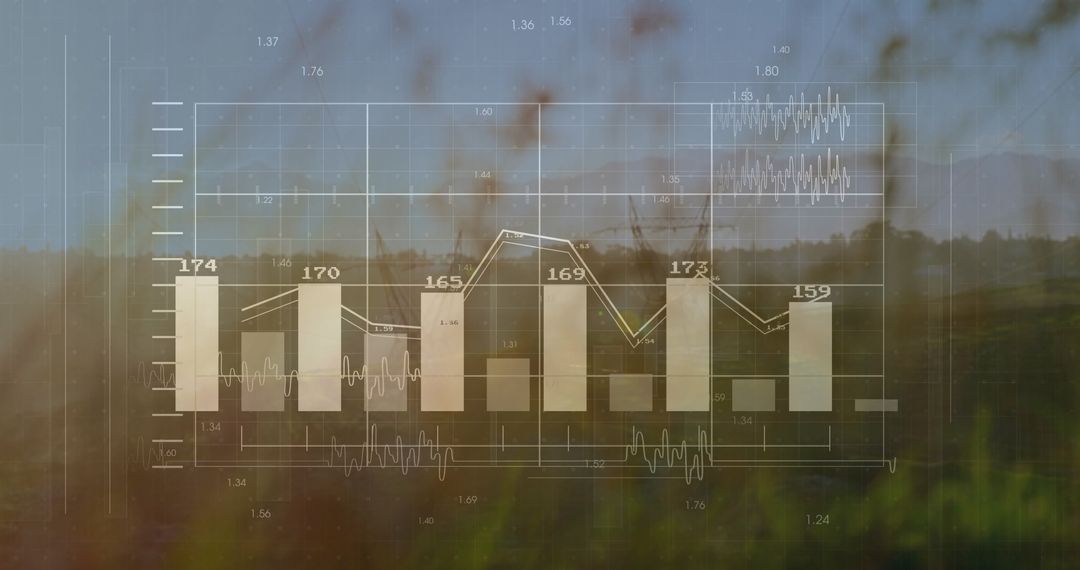
Overlay of chart bars against natural landscape, representing the convergence of data analytics and environmental considerations. Suitable for illustrating concepts in business growth, financial analysis, and the intersection of technology with the natural world.
Powered by 


0
downloads
downloads
Tags:
More
Credit Photo
If you would like to credit the Photo, here are some ways you can do so
Text Link
photo Link
<span class="text-link">
<span>
<a target="_blank" href=https://pikwizard.com/photo/data-visualization-combines-nature-and-finance-concepts/10fb94cf0870b906274a930689076a13/>PikWizard</a>
</span>
</span>
<span class="image-link">
<span
style="margin: 0 0 20px 0; display: inline-block; vertical-align: middle; width: 100%;"
>
<a
target="_blank"
href="https://pikwizard.com/photo/data-visualization-combines-nature-and-finance-concepts/10fb94cf0870b906274a930689076a13/"
style="text-decoration: none; font-size: 10px; margin: 0;"
>
<img src="https://pikwizard.com/pw/medium/10fb94cf0870b906274a930689076a13.jpg" style="margin: 0; width: 100%;" alt="" />
<p style="font-size: 12px; margin: 0;">PikWizard</p>
</a>
</span>
</span>
Free (free of charge)
Free for personal and commercial use.
Author: Awesome Content
Similar Free Stock Images
Premium


Premium


Premium


Premium


Premium


Premium


Premium


Premium


Premium


Premium


Premium


Premium


Premium


Premium


Premium


Premium


Premium


Premium


Premium


Premium


Premium


Premium


Premium


Premium