- Home >
- Stock Photos >
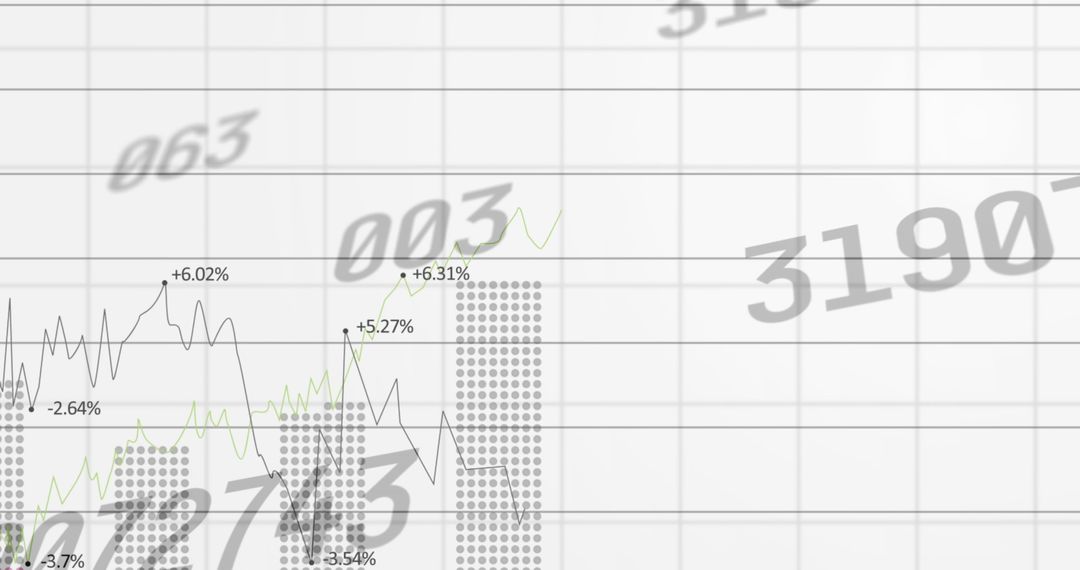
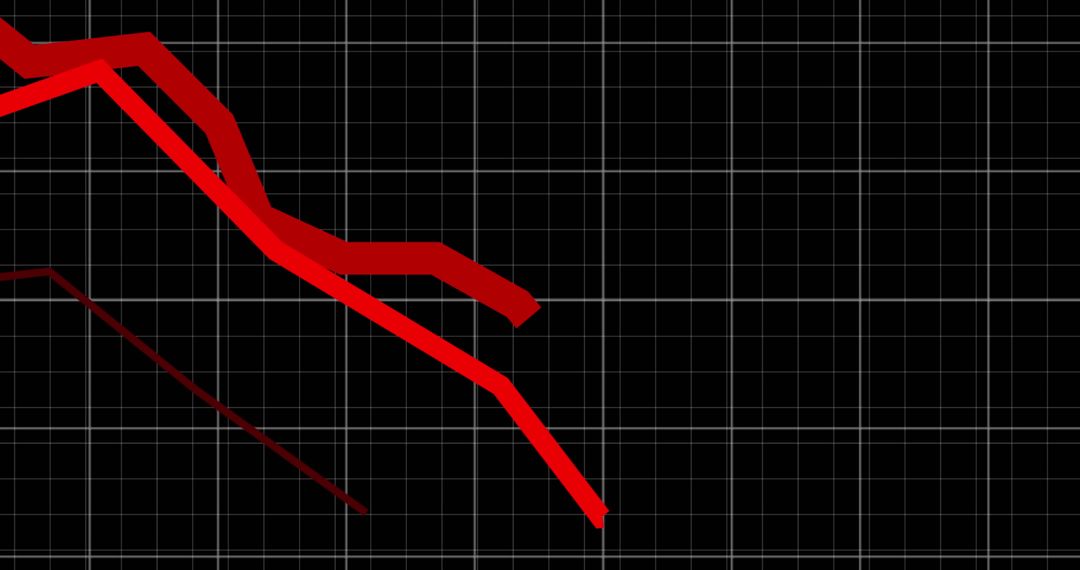
- Declining Financial Market Trends with Red Graph Lines
Declining Financial Market Trends with Red Graph Lines Image

Visual displays red graph lines indicating downward financial trends with statistical data on a gray grid background. Ideal for illustrating market analysis, supporting financial articles, or enhancing presentations related to economic declines.
Powered by 


2
downloads
downloads
Tags:
More
Credit Photo
If you would like to credit the Photo, here are some ways you can do so
Text Link
photo Link
<span class="text-link">
<span>
<a target="_blank" href=https://pikwizard.com/photo/declining-financial-market-trends-with-red-graph-lines/dd9835826220be43b52c3e70710aa560/>PikWizard</a>
</span>
</span>
<span class="image-link">
<span
style="margin: 0 0 20px 0; display: inline-block; vertical-align: middle; width: 100%;"
>
<a
target="_blank"
href="https://pikwizard.com/photo/declining-financial-market-trends-with-red-graph-lines/dd9835826220be43b52c3e70710aa560/"
style="text-decoration: none; font-size: 10px; margin: 0;"
>
<img src="https://pikwizard.com/pw/medium/dd9835826220be43b52c3e70710aa560.jpg" style="margin: 0; width: 100%;" alt="" />
<p style="font-size: 12px; margin: 0;">PikWizard</p>
</a>
</span>
</span>
Free (free of charge)
Free for personal and commercial use.
Author: Awesome Content
Similar Free Stock Images

Premium


Premium


Premium


Premium


Premium


Premium


Premium


Premium


Premium


Premium


Premium


Premium


Premium


Premium


Premium


Premium


Premium


Premium


Premium


Premium


Premium


Premium


Premium


Premium