
- Home >
- Stock Photos >
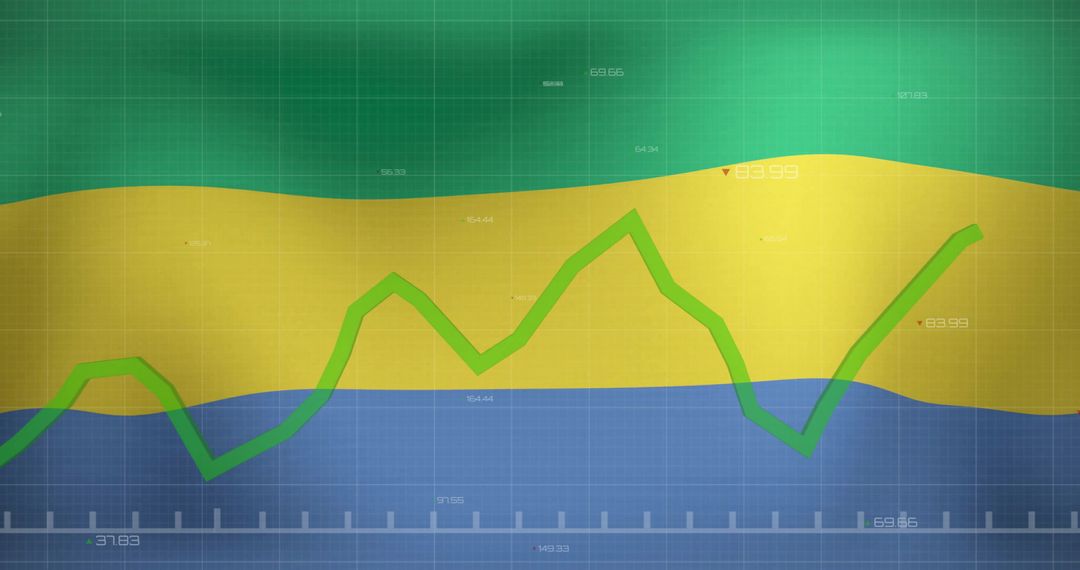
- Declining Stock Market Graph with Red Trend Line
Declining Stock Market Graph with Red Trend Line Image

Image of a declining stock market or financial data graph. The red trend line highlights a downwards decrease, crossing numbers that give a sense of real-time data or a network concept. Useful for illustrating articles or presentations on finance, economics, trading dynamics, or the risks of financial investment.
Powered by 


2
downloads
downloads
Tags:
More
Credit Photo
If you would like to credit the Photo, here are some ways you can do so
Text Link
photo Link
<span class="text-link">
<span>
<a target="_blank" href=https://pikwizard.com/photo/declining-stock-market-graph-with-red-trend-line/eb3fd5e03c9b1dccfbfb3652bff94971/>PikWizard</a>
</span>
</span>
<span class="image-link">
<span
style="margin: 0 0 20px 0; display: inline-block; vertical-align: middle; width: 100%;"
>
<a
target="_blank"
href="https://pikwizard.com/photo/declining-stock-market-graph-with-red-trend-line/eb3fd5e03c9b1dccfbfb3652bff94971/"
style="text-decoration: none; font-size: 10px; margin: 0;"
>
<img src="https://pikwizard.com/pw/medium/eb3fd5e03c9b1dccfbfb3652bff94971.jpg" style="margin: 0; width: 100%;" alt="" />
<p style="font-size: 12px; margin: 0;">PikWizard</p>
</a>
</span>
</span>
Free (free of charge)
Free for personal and commercial use.
Author: Authentic Images
Similar Free Stock Images

Premium


Premium


Premium


Premium


Premium


Premium


Premium


Premium


Premium


Premium


Premium


Premium


Premium


Premium


Premium


Premium


Premium


Premium


Premium


Premium


Premium


Premium


Premium


Premium

