
- Home >
- Stock Photos >
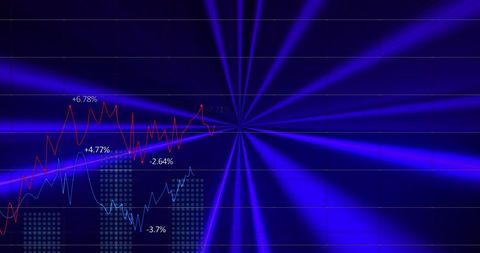
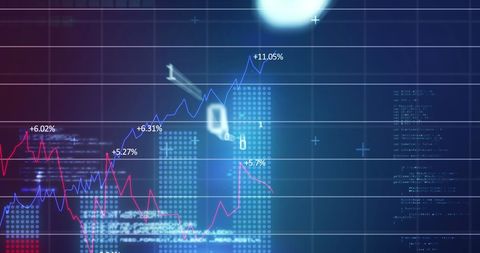
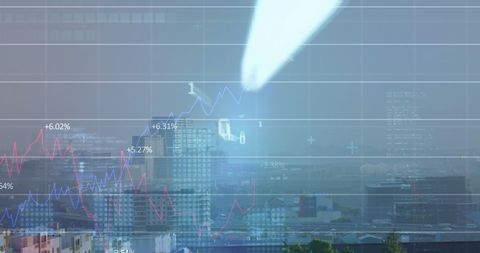
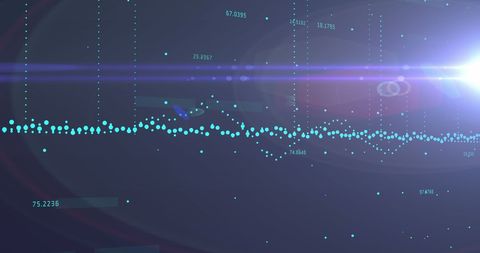
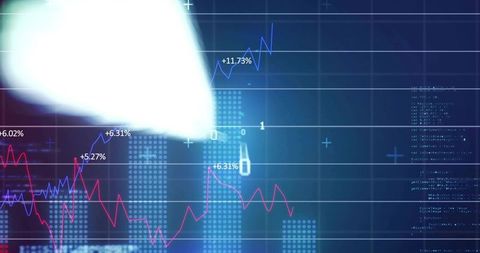
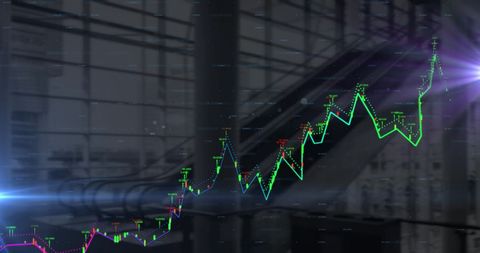
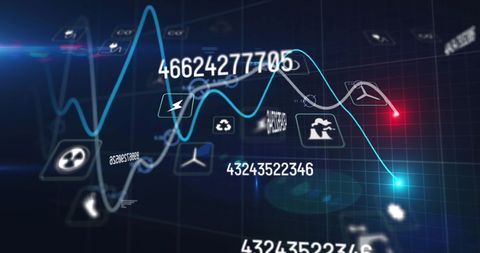
- Digital Analysis of Financial Trends and Global Economy Data
Digital Analysis of Financial Trends and Global Economy Data Image

Depicting financial data and graphs abstractly, this illustration caters to themes of global finance, economic analysis, and financial technology. Suitable for presentations, blogs on market trends, and technology-based finance articles.
Powered by  - Get 15% off with code: PIKWIZARD15


0
downloads
downloads
Tags:
More
Credit Photo
If you would like to credit the Photo, here are some ways you can do so
Text Link
photo Link
<span class="text-link">
<span>
<a target="_blank" href=https://pikwizard.com/photo/digital-analysis-of-financial-trends-and-global-economy-data/6e978cc2c6a99de024b314f4ef740bcb/>PikWizard</a>
</span>
</span>
<span class="image-link">
<span
style="margin: 0 0 20px 0; display: inline-block; vertical-align: middle; width: 100%;"
>
<a
target="_blank"
href="https://pikwizard.com/photo/digital-analysis-of-financial-trends-and-global-economy-data/6e978cc2c6a99de024b314f4ef740bcb/"
style="text-decoration: none; font-size: 10px; margin: 0;"
>
<img src="https://pikwizard.com/pw/medium/6e978cc2c6a99de024b314f4ef740bcb.jpg" style="margin: 0; width: 100%;" alt="" />
<p style="font-size: 12px; margin: 0;">PikWizard</p>
</a>
</span>
</span>
Free (free of charge)
Free for personal and commercial use.
Author: People Creations
Similar Free Stock Images

Premium


Premium


Premium


Premium


Premium


Premium


Premium


Premium


Premium


Premium


Premium


Premium


Premium


Premium


Premium


Premium


Premium


Premium


Premium


Premium


Premium


Premium


Premium


Premium


Premium

