- Home >
- Stock Photos >
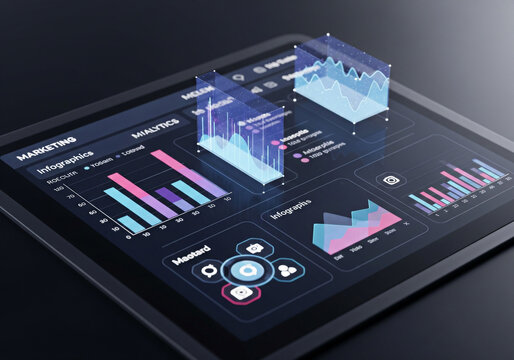
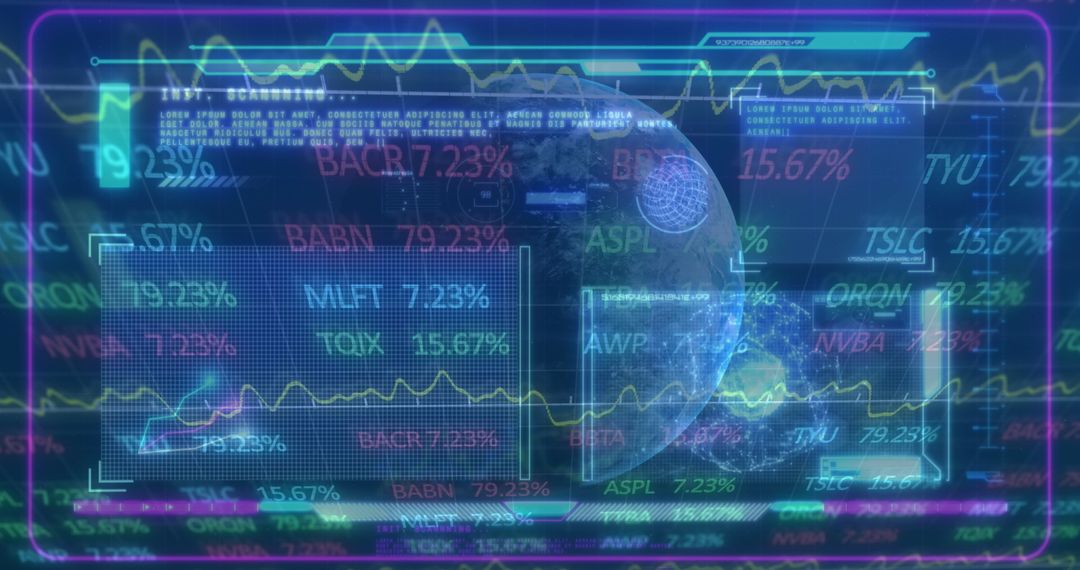
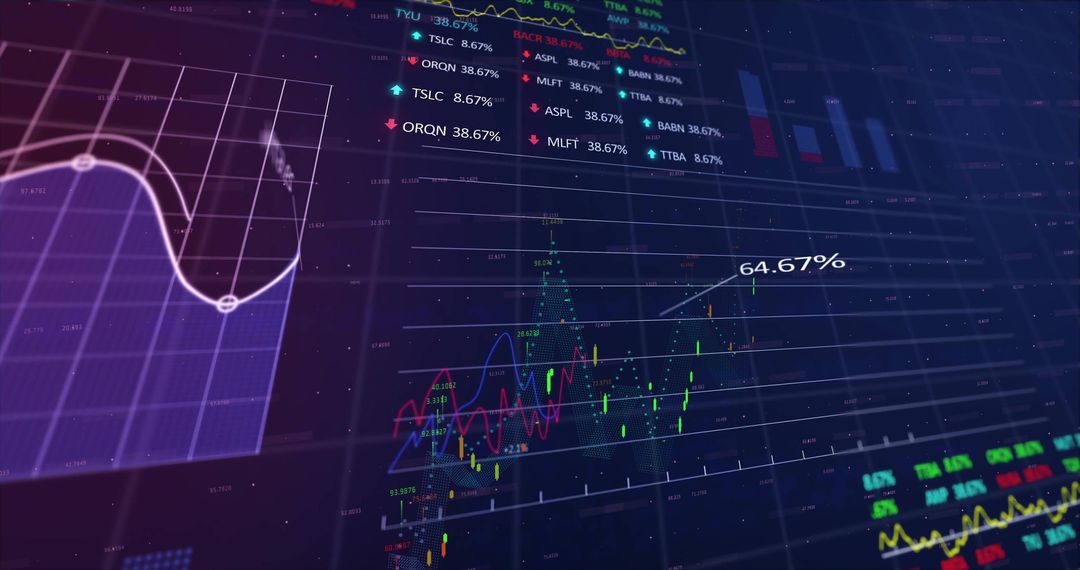
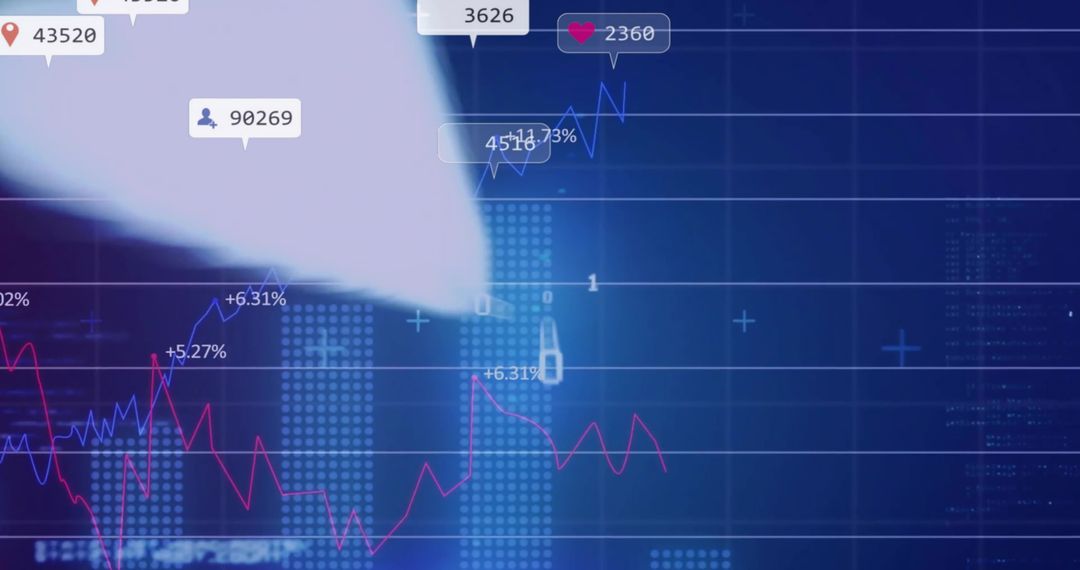
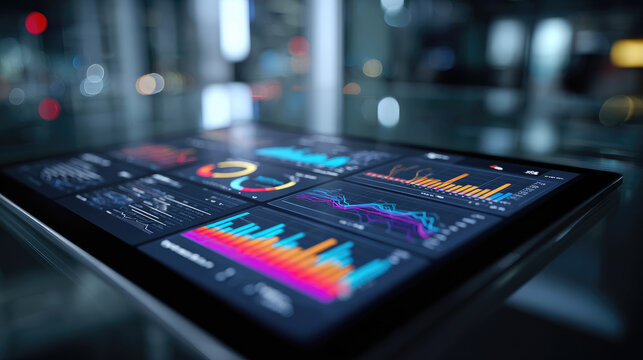
- Digital Analytics Dashboard with Charts and Percent Metrics
Digital Analytics Dashboard with Charts and Percent Metrics Image

Digital dashboard displaying red and blue fluctuating charts along with numeric percentage indicators, all overlayed with floating hexagonal icons signifying concepts like energy. Perfect for illustrating online articles, reports, or presentations on technology, innovation, climate change data, or data analysis platforms. Ideal for content focused on explaining analytical tools, data-driven decision making, or energy management strategies.
Powered by 


0
downloads
downloads
Tags:
More
Credit Photo
If you would like to credit the Photo, here are some ways you can do so
Text Link
photo Link
<span class="text-link">
<span>
<a target="_blank" href=https://pikwizard.com/photo/digital-analytics-dashboard-with-charts-and-percent-metrics/0d296862cd13d022abbe4213cc54e3cb/>PikWizard</a>
</span>
</span>
<span class="image-link">
<span
style="margin: 0 0 20px 0; display: inline-block; vertical-align: middle; width: 100%;"
>
<a
target="_blank"
href="https://pikwizard.com/photo/digital-analytics-dashboard-with-charts-and-percent-metrics/0d296862cd13d022abbe4213cc54e3cb/"
style="text-decoration: none; font-size: 10px; margin: 0;"
>
<img src="https://pikwizard.com/pw/medium/0d296862cd13d022abbe4213cc54e3cb.jpg" style="margin: 0; width: 100%;" alt="" />
<p style="font-size: 12px; margin: 0;">PikWizard</p>
</a>
</span>
</span>
Free (free of charge)
Free for personal and commercial use.
Author: Authentic Images
Similar Free Stock Images

Premium


Premium


Premium


Premium


Premium


Premium


Premium


Premium


Premium


Premium


Premium


Premium


Premium


Premium


Premium


Premium


Premium


Premium


Premium


Premium


Premium


Premium


Premium


Premium