
- Home >
- Stock Photos >
- Digital Analytics Dashboard with Trending Metrics and Graphs
Digital Analytics Dashboard with Trending Metrics and Graphs Image
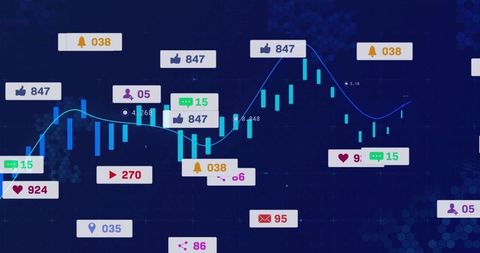
The image showcases a sophisticated digital analytics interface featuring candlestick charts with a prominent cyan line graph. Various social interaction icons with quantitative labels overlay the visual, indicating real-time data tracking and strategic communication assessments. This image is ideal for using in educational content related to data science or finance, illustrating digital transformation, corporate analysis reports, or enhancing business webinars that aim to teach key competitive analytical skills.
Powered by 


2
downloads
downloads
Tags:
More
Credit Photo
If you would like to credit the Photo, here are some ways you can do so
Text Link
photo Link
<span class="text-link">
<span>
<a target="_blank" href=https://pikwizard.com/photo/digital-analytics-dashboard-with-trending-metrics-and-graphs/48f579580f5042a6d52f288c0cc53e73/>PikWizard</a>
</span>
</span>
<span class="image-link">
<span
style="margin: 0 0 20px 0; display: inline-block; vertical-align: middle; width: 100%;"
>
<a
target="_blank"
href="https://pikwizard.com/photo/digital-analytics-dashboard-with-trending-metrics-and-graphs/48f579580f5042a6d52f288c0cc53e73/"
style="text-decoration: none; font-size: 10px; margin: 0;"
>
<img src="https://pikwizard.com/pw/medium/48f579580f5042a6d52f288c0cc53e73.jpg" style="margin: 0; width: 100%;" alt="" />
<p style="font-size: 12px; margin: 0;">PikWizard</p>
</a>
</span>
</span>
Free (free of charge)
Free for personal and commercial use.
Author: Awesome Content