- Home >
- Stock Photos >
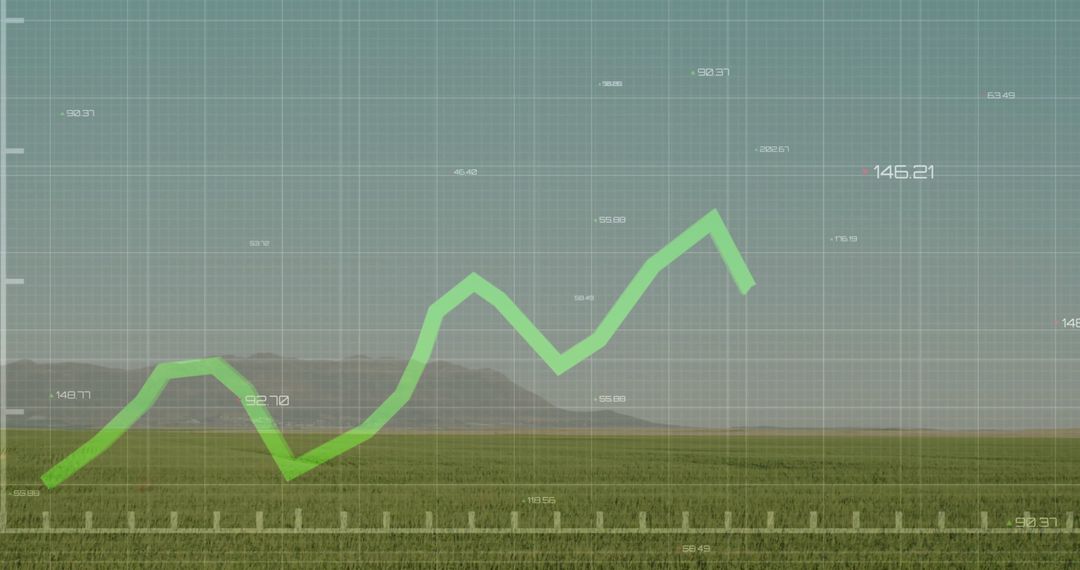
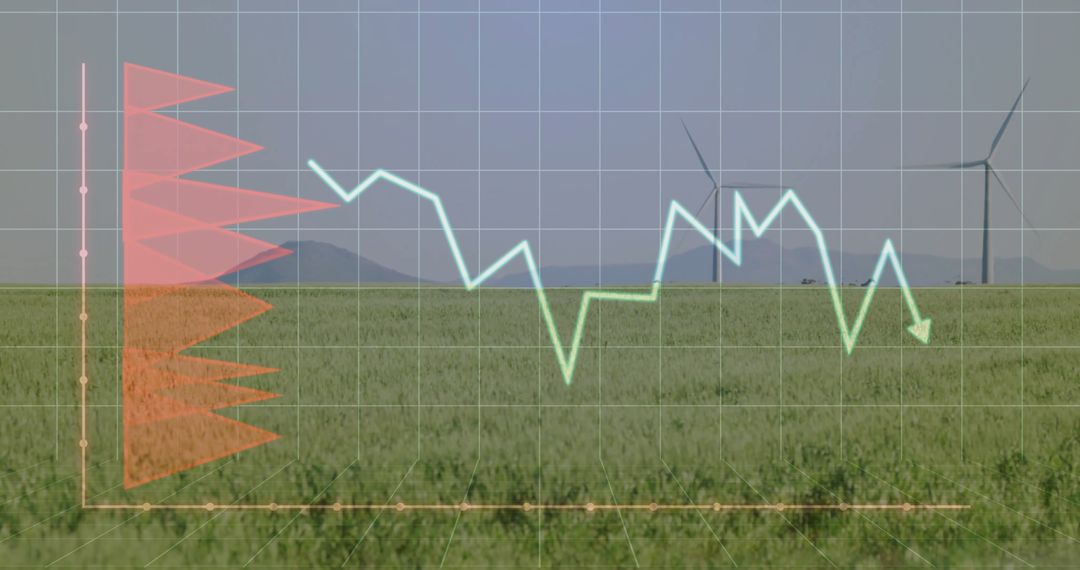
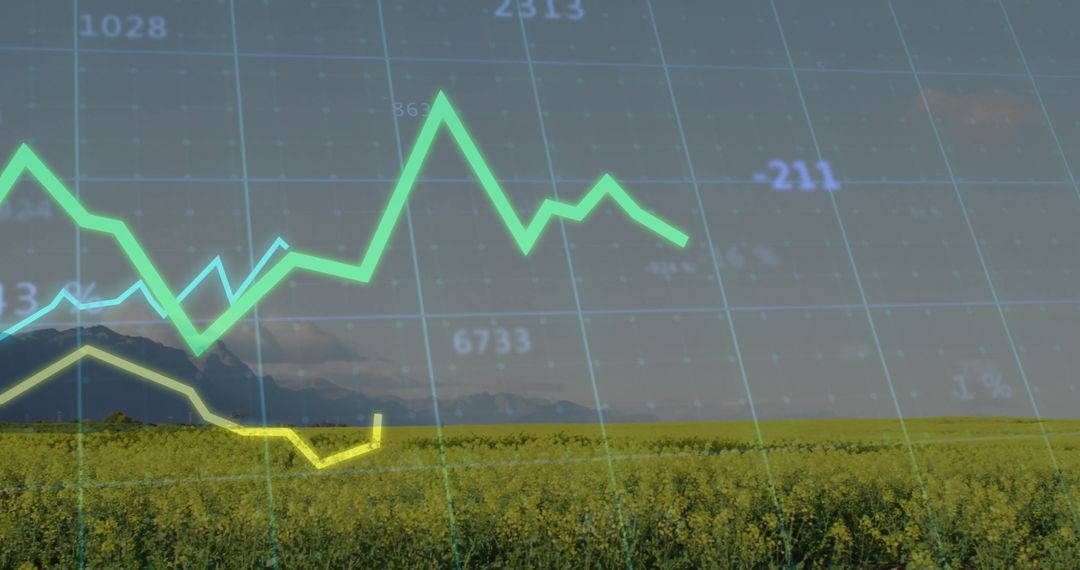
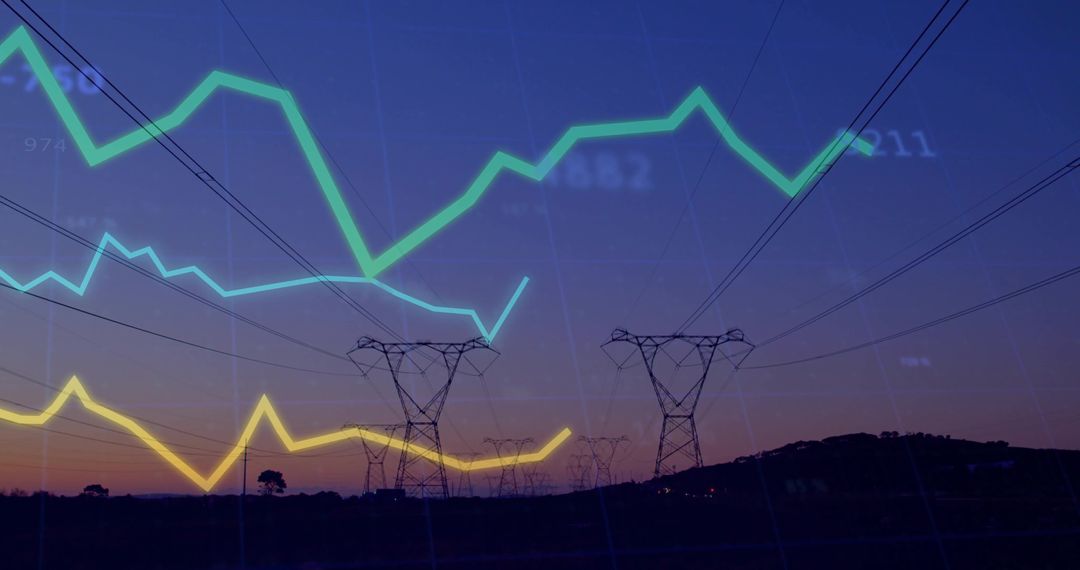
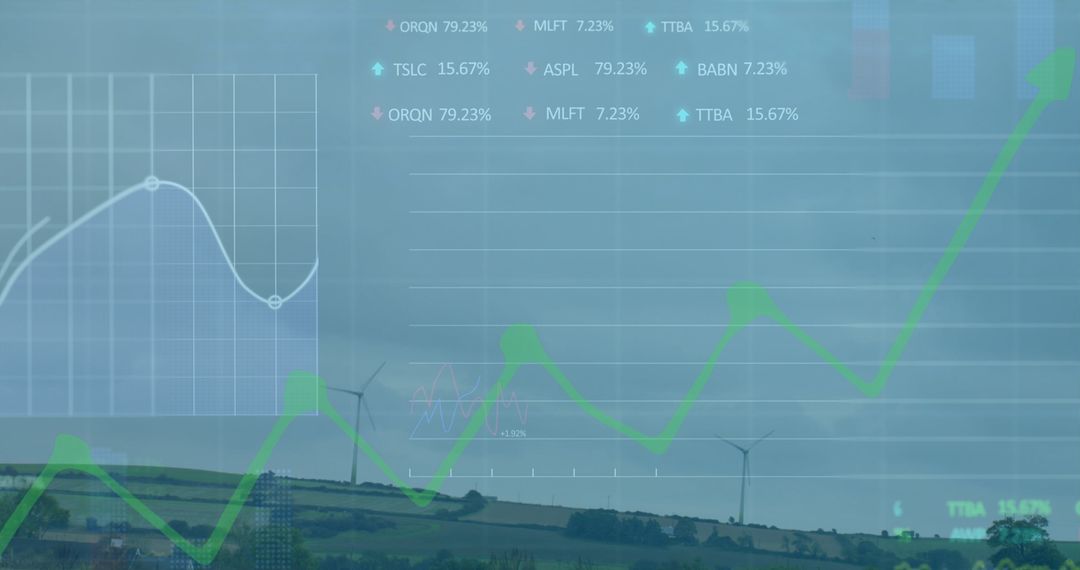
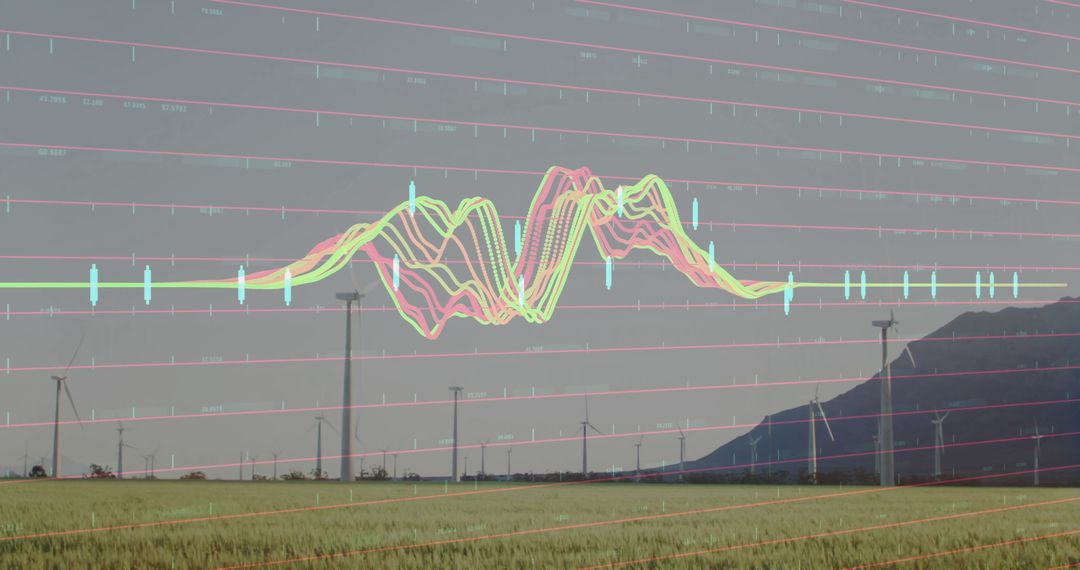
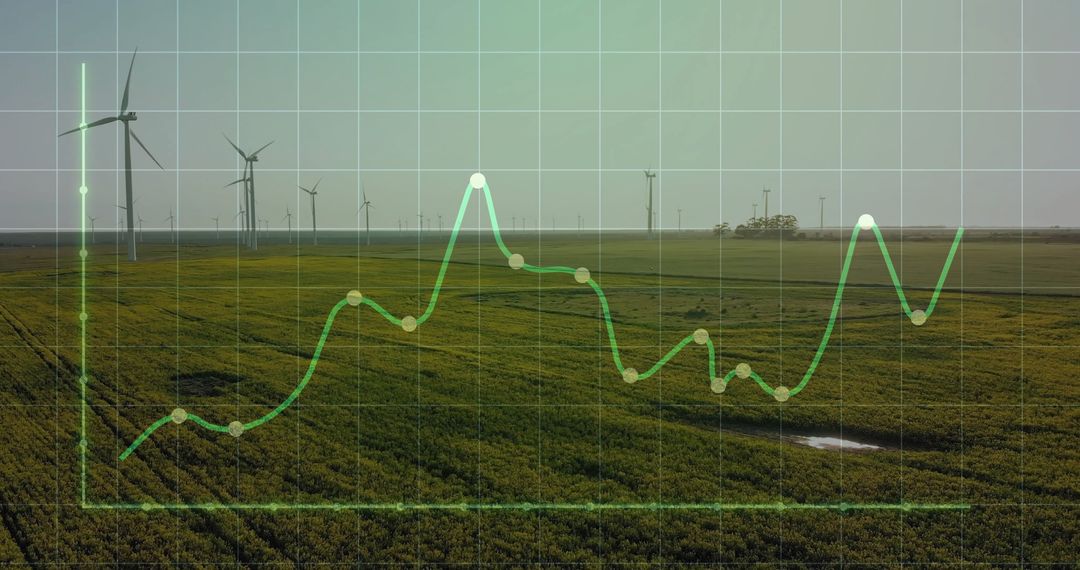
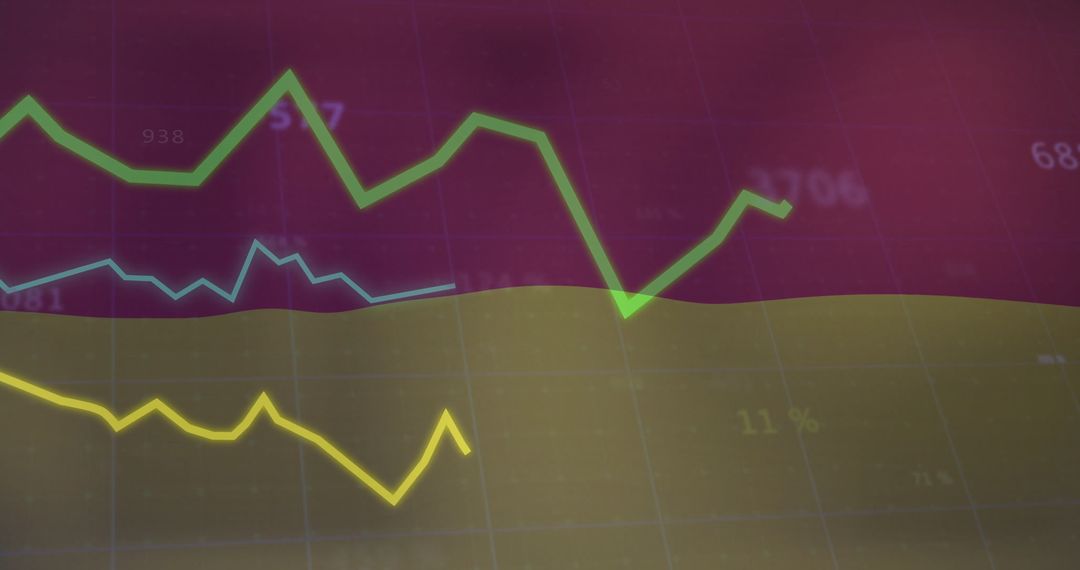
- Digital Analytics Overlay on Rural Landscape, Charting Data
Digital Analytics Overlay on Rural Landscape, Charting Data Image
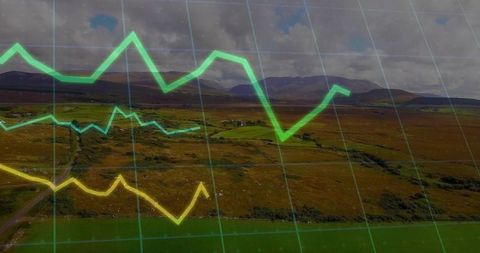
Scene merging technology and nature with translucent line graphs and grids over grassy moorland. Perfect for illustrating the impact of technology on the environment or data analytics topics in rural contexts.
Powered by  - Get 15% off with code: PIKWIZARD15


0
downloads
downloads
Tags:
More
Credit Photo
If you would like to credit the Photo, here are some ways you can do so
Text Link
photo Link
<span class="text-link">
<span>
<a target="_blank" href=https://pikwizard.com/photo/digital-analytics-overlay-on-rural-landscape-charting-data/525738eb1dabd9d6ff665a5645ea2349/>PikWizard</a>
</span>
</span>
<span class="image-link">
<span
style="margin: 0 0 20px 0; display: inline-block; vertical-align: middle; width: 100%;"
>
<a
target="_blank"
href="https://pikwizard.com/photo/digital-analytics-overlay-on-rural-landscape-charting-data/525738eb1dabd9d6ff665a5645ea2349/"
style="text-decoration: none; font-size: 10px; margin: 0;"
>
<img src="https://pikwizard.com/pw/medium/525738eb1dabd9d6ff665a5645ea2349.jpg" style="margin: 0; width: 100%;" alt="" />
<p style="font-size: 12px; margin: 0;">PikWizard</p>
</a>
</span>
</span>
Free (free of charge)
Free for personal and commercial use.
Author: People Creations
Similar Free Stock Images
Premium


Premium


Premium


Premium


Premium


Premium


Premium


Premium


Premium


Premium


Premium


Premium


Premium


Premium


Premium


Premium


Premium


Premium


Premium


Premium


Premium


Premium


Premium


Premium