- Home >
- Stock Photos >
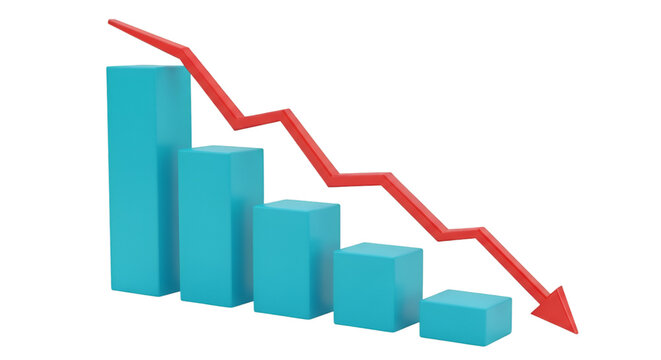
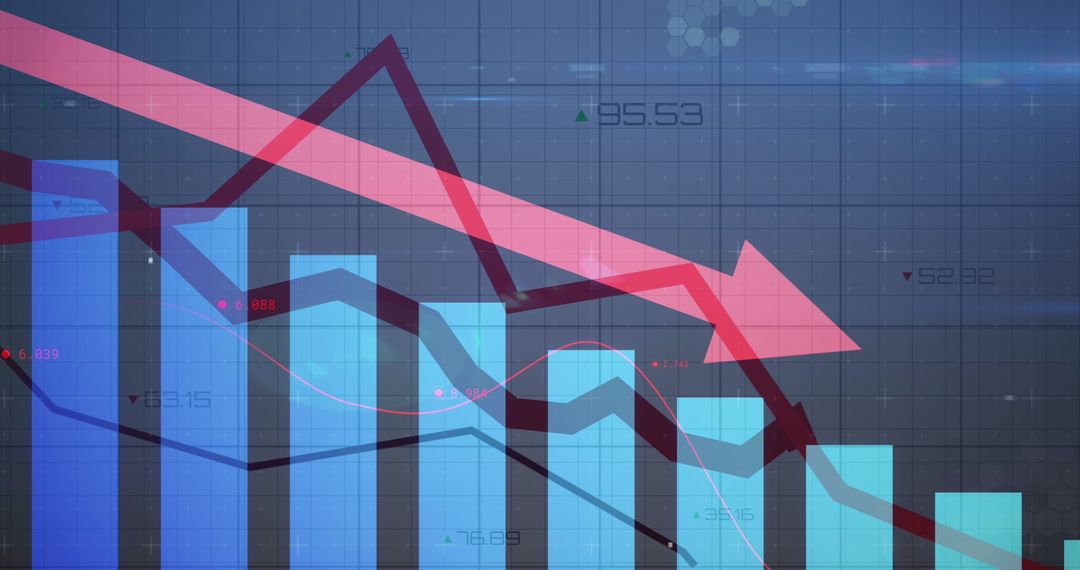
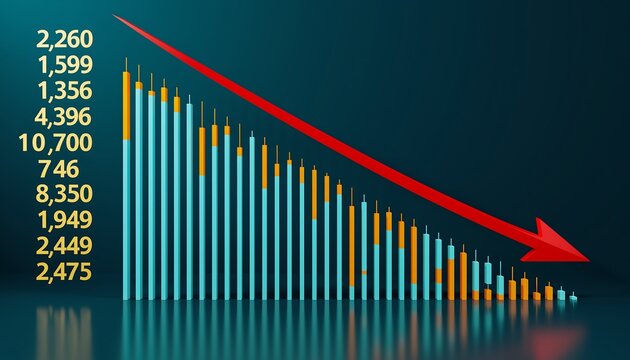
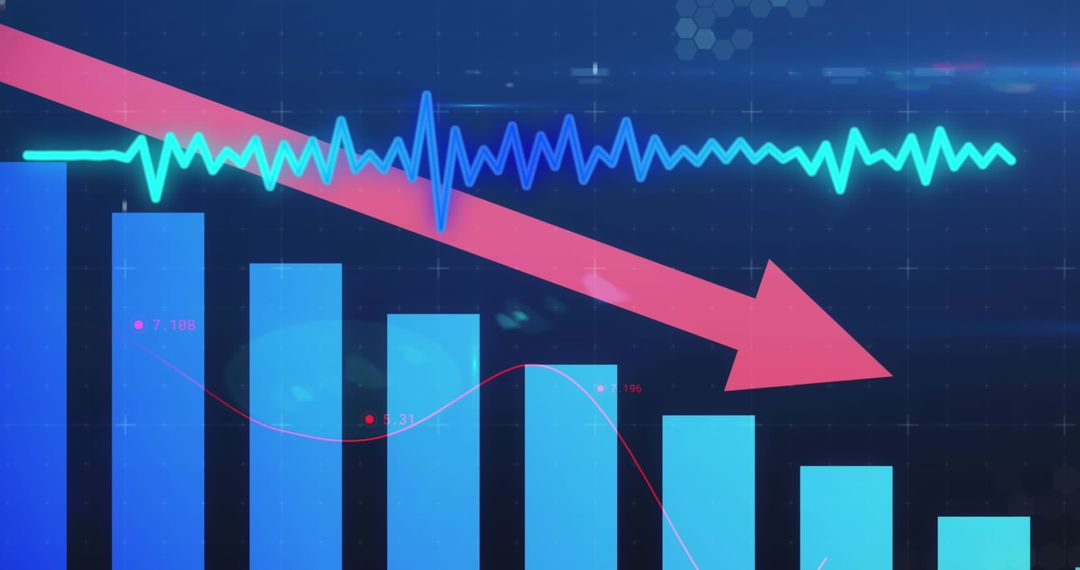
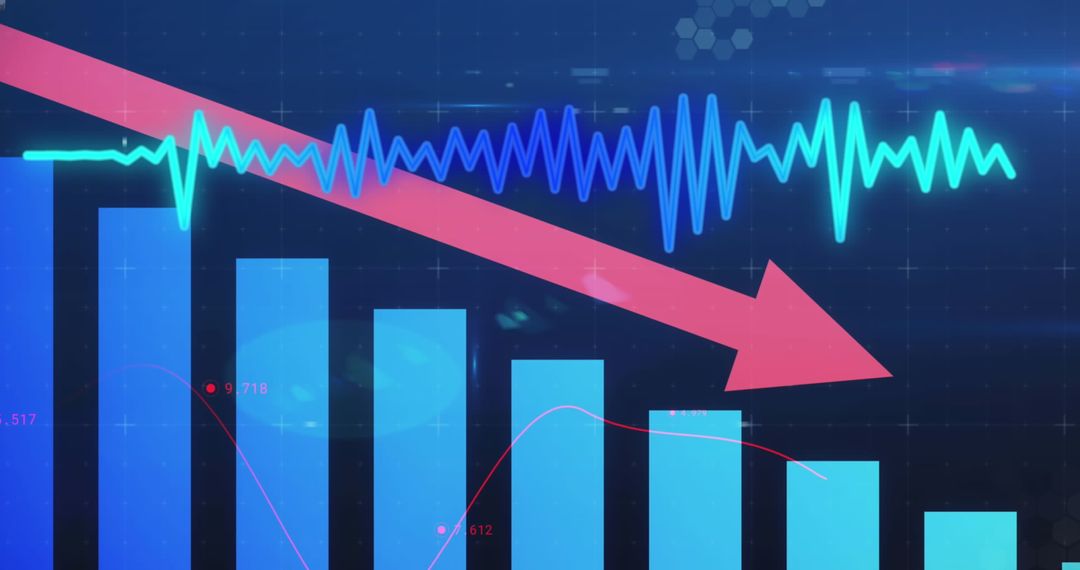
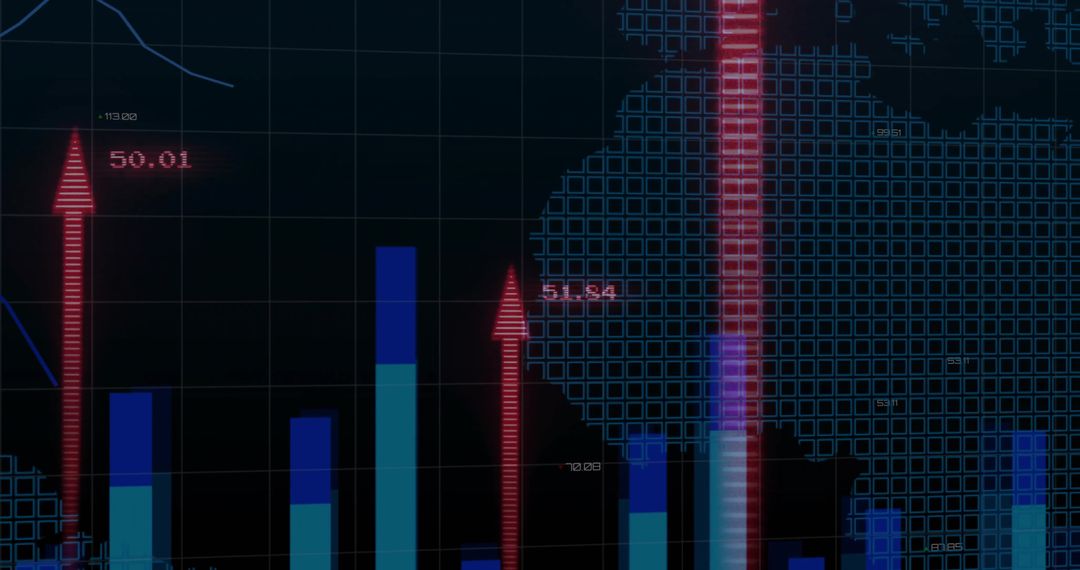
- Digital Bar Chart Highlighting Downward Business Trend
Digital Bar Chart Highlighting Downward Business Trend Image

Illustrating a business aspect, this graphic accentuates a slide in financials with a pronounced red arrow directed under a series of diminishing bars placed methodically on a grid layout, easing clarity in digital, technological blog themes, analytics-related PowerPoint presentations, and finance-oriented web displays, making prominent understanding repetitively desirable over bursting competition level insufficiency.
Powered by 


0
downloads
downloads
Tags:
More
Credit Photo
If you would like to credit the Photo, here are some ways you can do so
Text Link
photo Link
<span class="text-link">
<span>
<a target="_blank" href=https://pikwizard.com/photo/digital-bar-chart-highlighting-downward-business-trend/a2cc1af8cd079d7375c0b09d57bd5496/>PikWizard</a>
</span>
</span>
<span class="image-link">
<span
style="margin: 0 0 20px 0; display: inline-block; vertical-align: middle; width: 100%;"
>
<a
target="_blank"
href="https://pikwizard.com/photo/digital-bar-chart-highlighting-downward-business-trend/a2cc1af8cd079d7375c0b09d57bd5496/"
style="text-decoration: none; font-size: 10px; margin: 0;"
>
<img src="https://pikwizard.com/pw/medium/a2cc1af8cd079d7375c0b09d57bd5496.jpg" style="margin: 0; width: 100%;" alt="" />
<p style="font-size: 12px; margin: 0;">PikWizard</p>
</a>
</span>
</span>
Free (free of charge)
Free for personal and commercial use.
Author: People Creations
Similar Free Stock Images
Premium


Premium


Premium


Premium


Premium


Premium


Premium


Premium


Premium


Premium


Premium


Premium


Premium


Premium


Premium


Premium


Premium


Premium


Premium


Premium


Premium


Premium


Premium


Premium