- Home >
- Stock Photos >
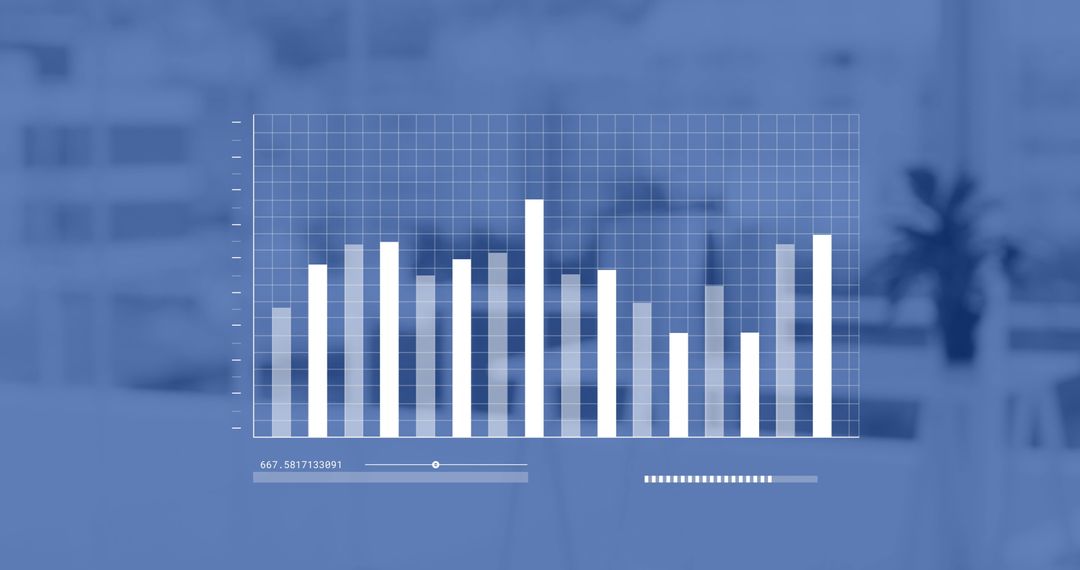
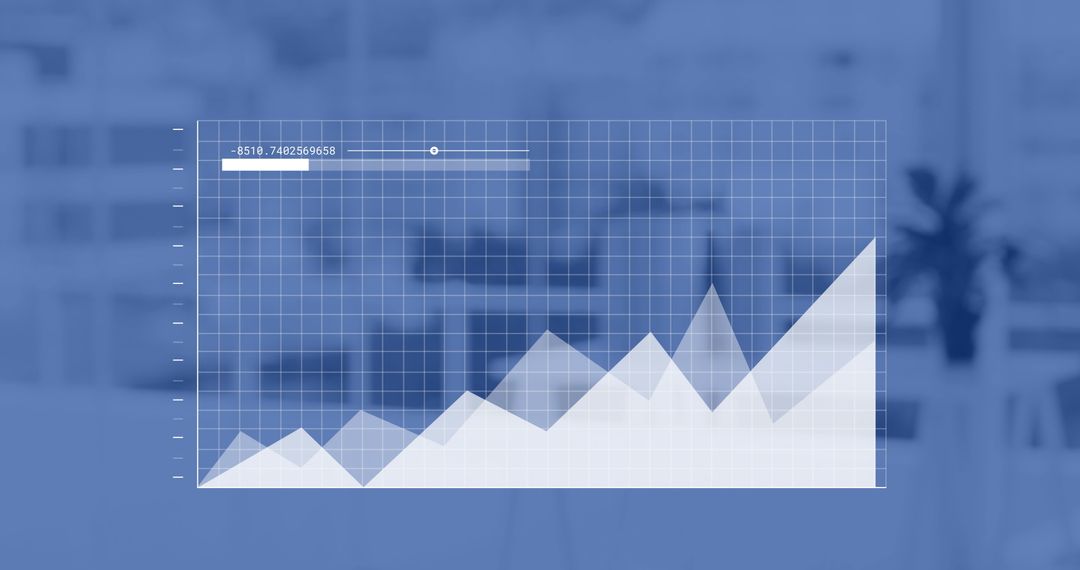
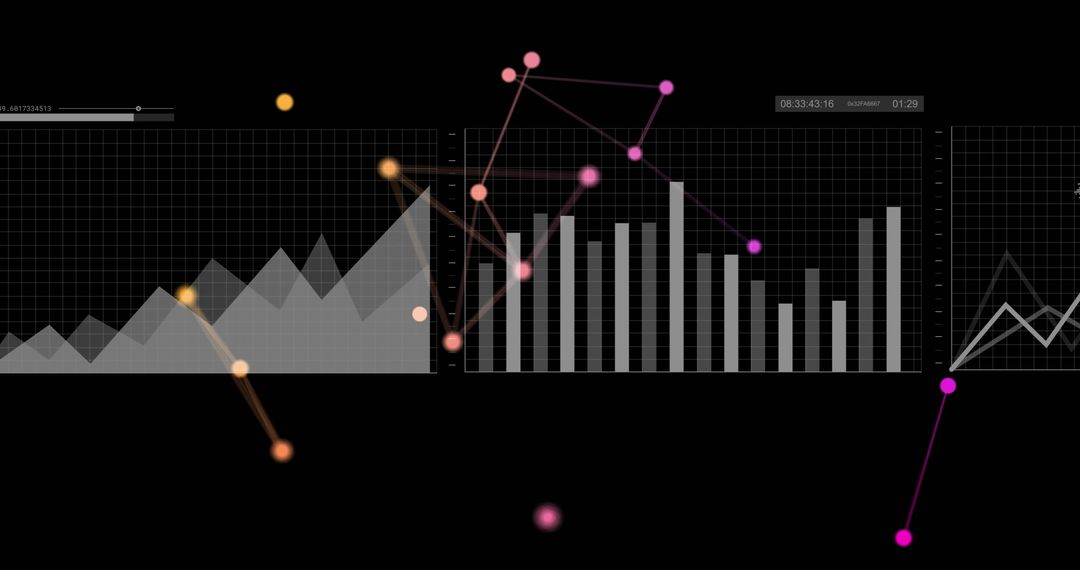
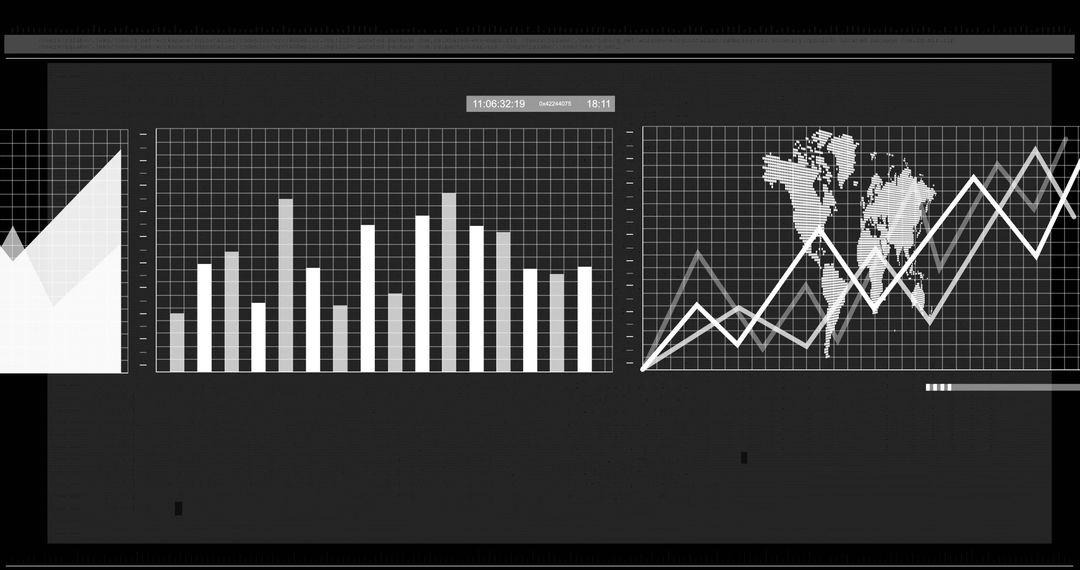
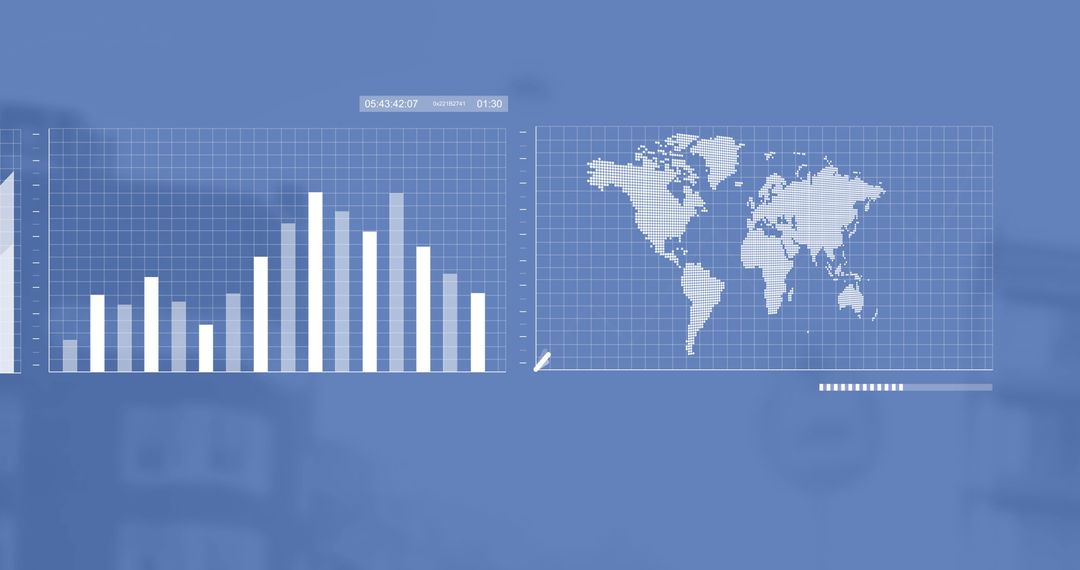
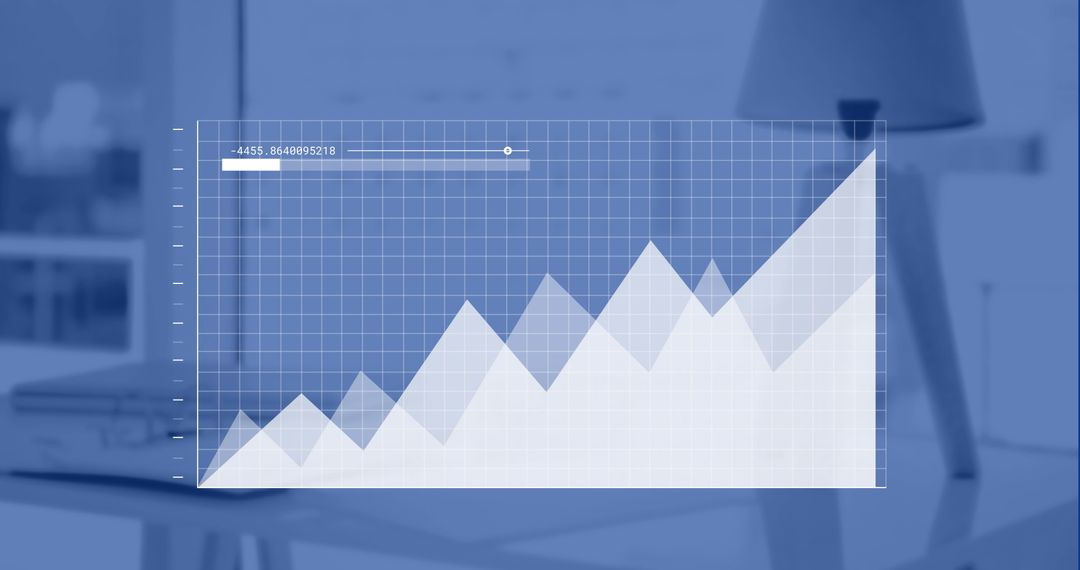
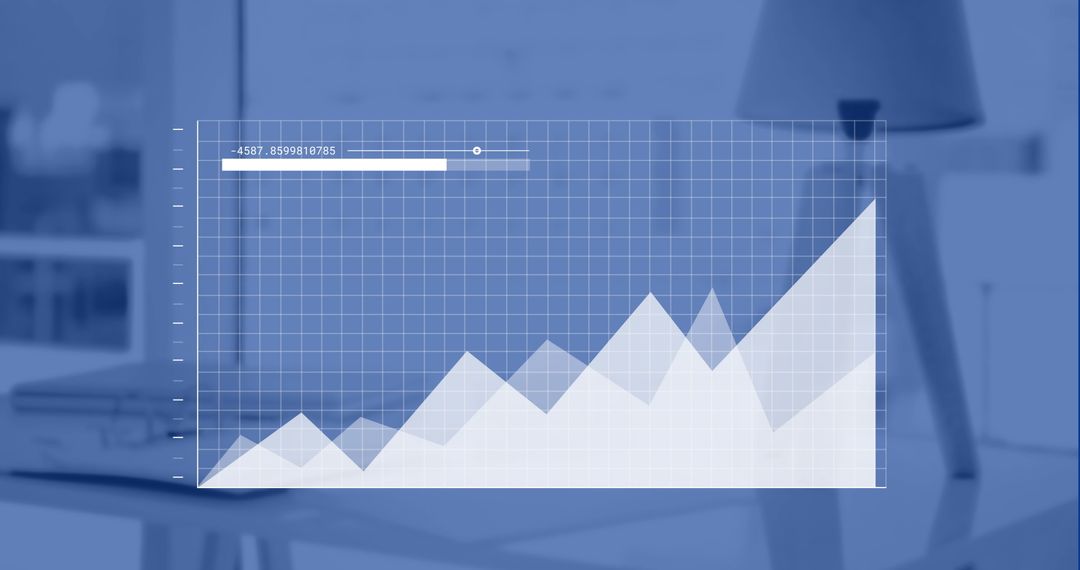
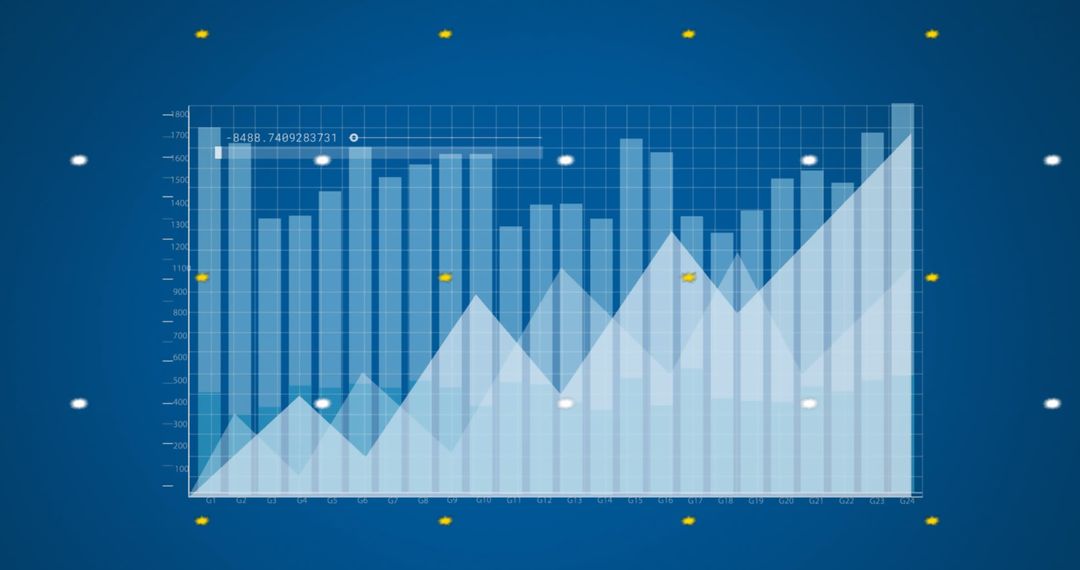
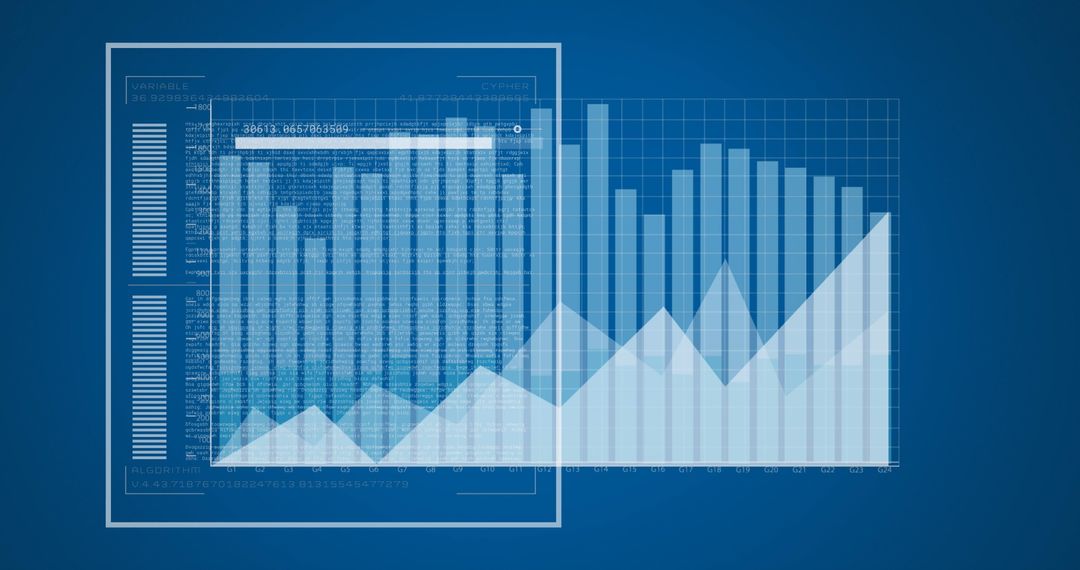
- Digital Business Graphs with Growth and Analysis Concepts
Digital Business Graphs with Growth and Analysis Concepts Image

Visual showing digital graphs depicting business growth and data analysis overlays office background, symbolizing modern finance and data-driven decision making. Useful for presentations on financial performance, data analytics workshops, IT solutions advertisement, or corporate progress reports.
Powered by 


0
downloads
downloads
Tags:
More
Credit Photo
If you would like to credit the Photo, here are some ways you can do so
Text Link
photo Link
<span class="text-link">
<span>
<a target="_blank" href=https://pikwizard.com/photo/digital-business-graphs-with-growth-and-analysis-concepts/89488cba002bd2bc95e449b2d5401e80/>PikWizard</a>
</span>
</span>
<span class="image-link">
<span
style="margin: 0 0 20px 0; display: inline-block; vertical-align: middle; width: 100%;"
>
<a
target="_blank"
href="https://pikwizard.com/photo/digital-business-graphs-with-growth-and-analysis-concepts/89488cba002bd2bc95e449b2d5401e80/"
style="text-decoration: none; font-size: 10px; margin: 0;"
>
<img src="https://pikwizard.com/pw/medium/89488cba002bd2bc95e449b2d5401e80.jpg" style="margin: 0; width: 100%;" alt="" />
<p style="font-size: 12px; margin: 0;">PikWizard</p>
</a>
</span>
</span>
Free (free of charge)
Free for personal and commercial use.
Author: People Creations
Similar Free Stock Images
Premium


Premium


Premium


Premium


Premium


Premium


Premium


Premium


Premium


Premium


Premium


Premium


Premium


Premium


Premium


Premium


Premium


Premium


Premium


Premium


Premium


Premium


Premium


Premium