- Home >
- Stock Photos >
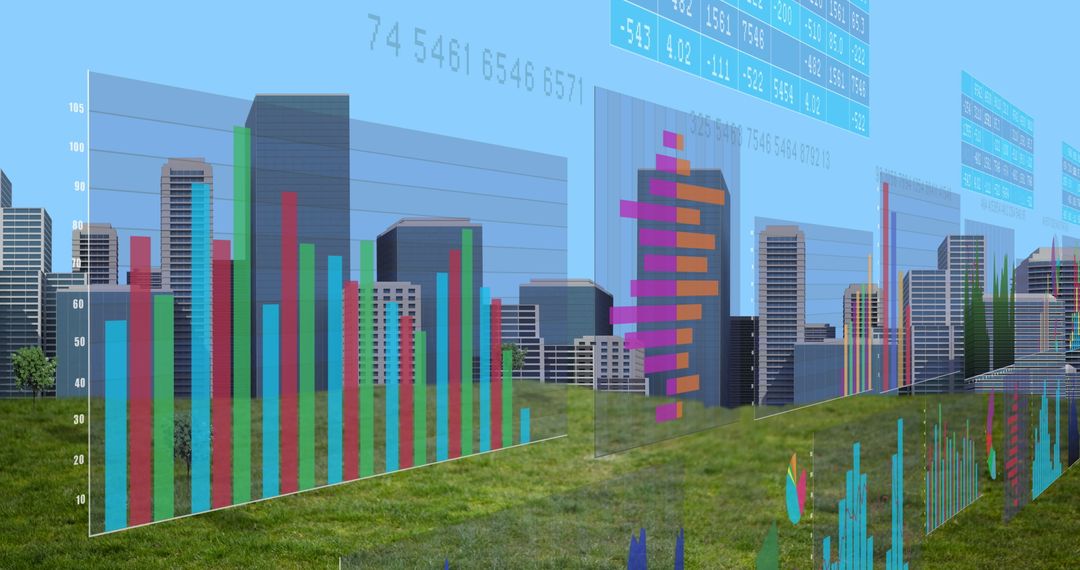
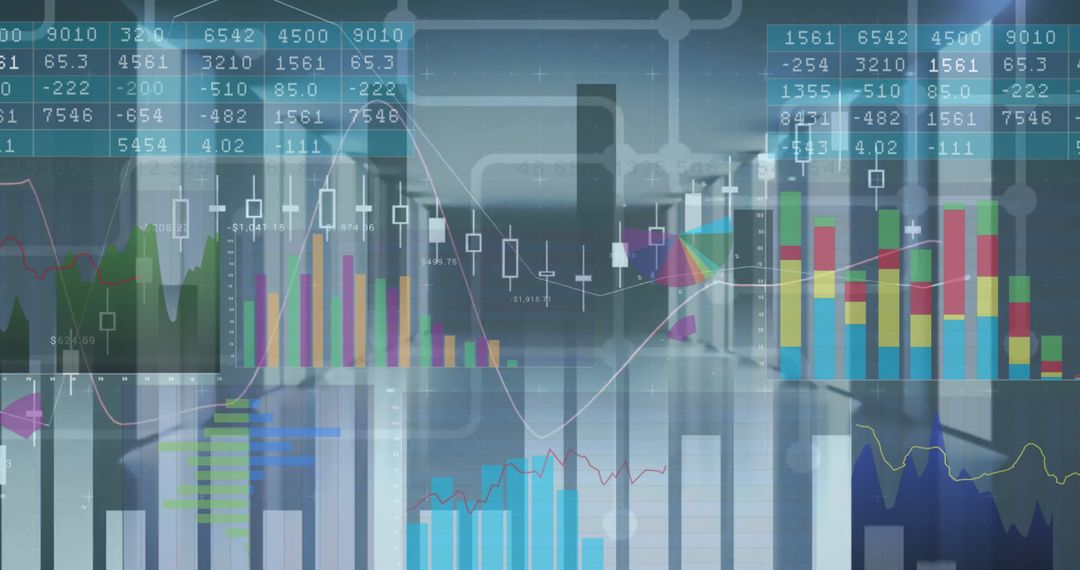
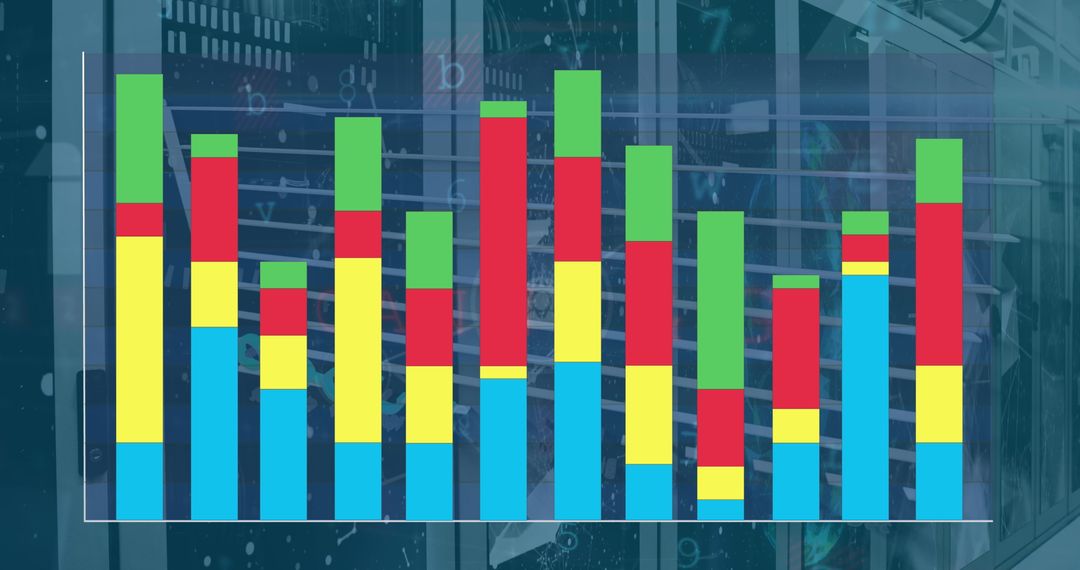
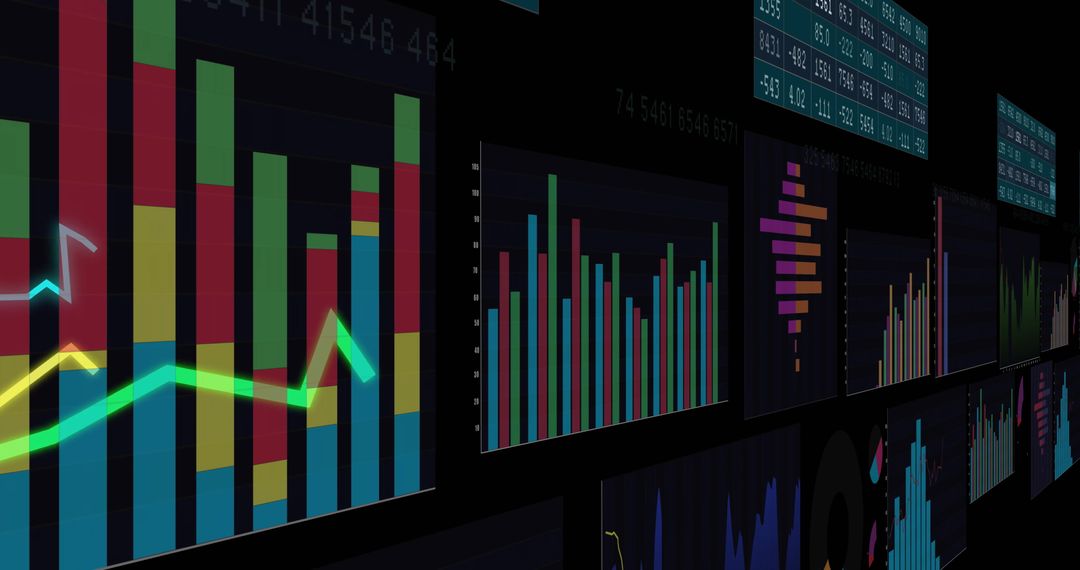
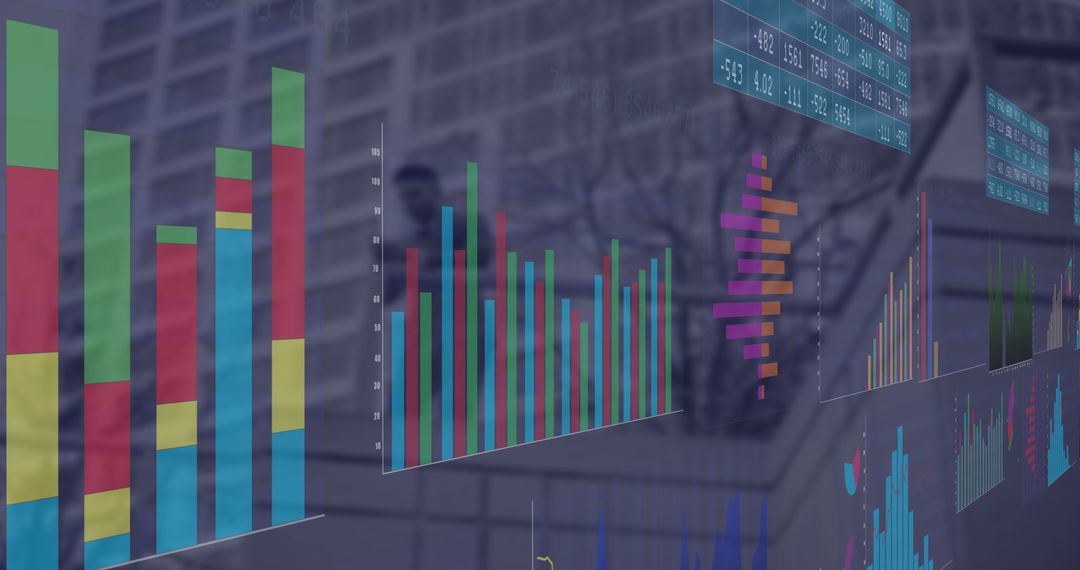
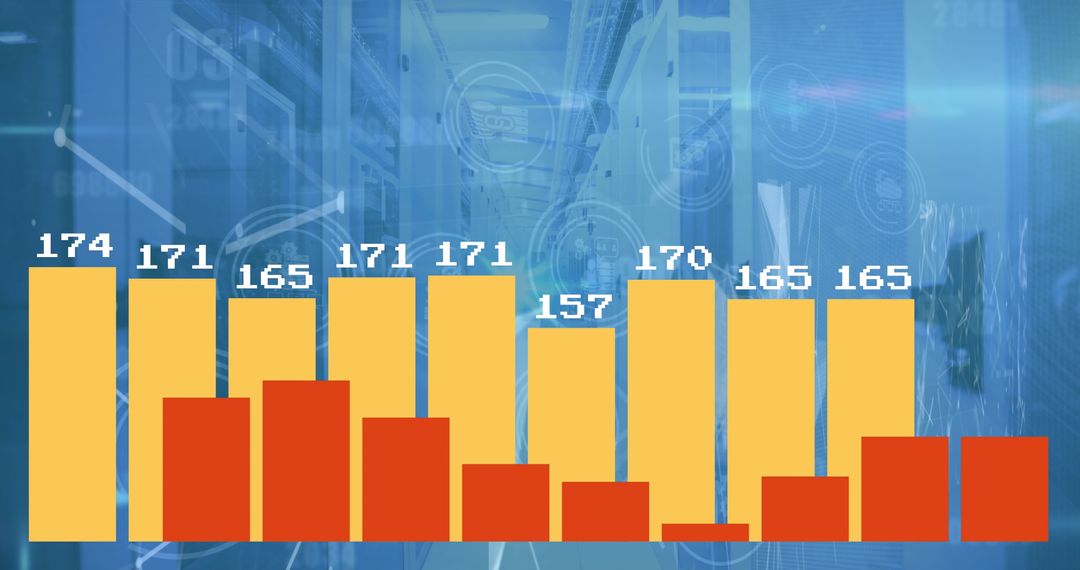
- Digital Charts Displaying Business Financial Analytics in Office Environment
Digital Charts Displaying Business Financial Analytics in Office Environment Image
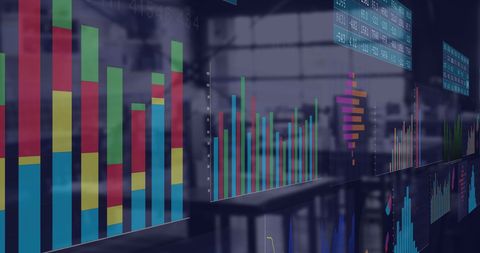
Visual representation of bar graphs and statistics reflecting business financial data, suitable for presentations on financial analysis, global business strategy, or digital data processing. Helpful for companies presenting data concepts or individuals working in financial technology sectors.
Powered by  - Get 15% off with code: PIKWIZARD15


2
downloads
downloads
Tags:
More
Credit Photo
If you would like to credit the Photo, here are some ways you can do so
Text Link
photo Link
<span class="text-link">
<span>
<a target="_blank" href=https://pikwizard.com/photo/digital-charts-displaying-business-financial-analytics-in-office-environment/2bbd79381f85c22db209160bc5f3d23d/>PikWizard</a>
</span>
</span>
<span class="image-link">
<span
style="margin: 0 0 20px 0; display: inline-block; vertical-align: middle; width: 100%;"
>
<a
target="_blank"
href="https://pikwizard.com/photo/digital-charts-displaying-business-financial-analytics-in-office-environment/2bbd79381f85c22db209160bc5f3d23d/"
style="text-decoration: none; font-size: 10px; margin: 0;"
>
<img src="https://pikwizard.com/pw/medium/2bbd79381f85c22db209160bc5f3d23d.jpg" style="margin: 0; width: 100%;" alt="" />
<p style="font-size: 12px; margin: 0;">PikWizard</p>
</a>
</span>
</span>
Free (free of charge)
Free for personal and commercial use.
Author: Awesome Content
Similar Free Stock Images

Premium


Premium


Premium


Premium


Premium


Premium


Premium


Premium


Premium


Premium


Premium


Premium


Premium


Premium


Premium


Premium


Premium


Premium


Premium


Premium


Premium


Premium


Premium


Premium